5. View edge status - Edge Finder#
Edge Finder v2.6.0
5.1. View the list of edges#
Use the Edge Finder to see if an edge is online or to see real-time data being transmitted from the edge to the intdash server.
Open Edge Finder ( <base_URL>/edges/ ). If you already have an intdash application open, you can also go to the Edge Finder with the  button at the top right of the screen.
The edge list can be reordered and filtered. See View the list of edges for more information.
Note
When you send data using the iOS application intdash Motion, an edge account with the same name as your user name (or in some cases "<username>_edge") is automatically created and the data is sent using that edge account.
The items displayed in the edge list screen are as follows.
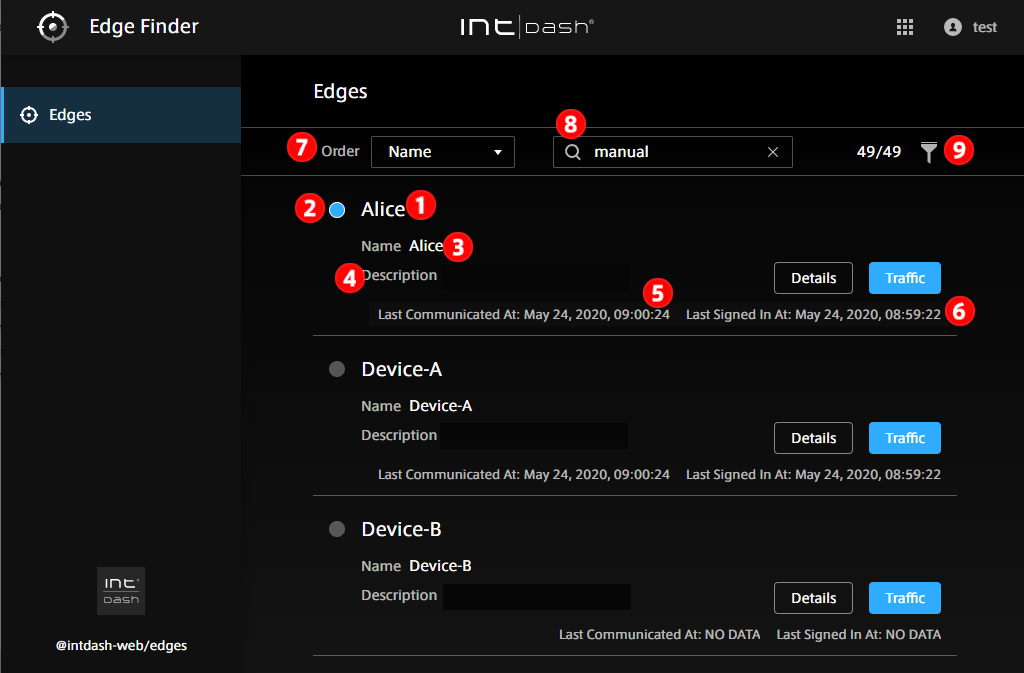
Fig. 12 Edge list#
 Edge name (nickname if the edge has a nickname)
 Connection status (
 ![]() blue: online,
blue: online, ![]() gray: offline)
gray: offline)
 Edge name
 Description
 Date and time this edge last communicated with the intdash server
 Date and time when this edge last signed in to intdash
 Change the order
 Search by string (You can search by UUID, name, nickname, or description. You can search by AND condition by separating keywords with spaces.
 Filter by type or connection status (
 ![]() )
)
Hint
The connection status is determined by the presence or absence of communication with intdash. It may take about 15 seconds for the latest connection status to be reflected on the screen.
Hint
When you change the order, search for a string, or specify a filter, the URL of the current list is displayed in the address bar of the web browser. By bookmarking this URL, you can view the list using the same search criteria.
5.2. Check traffic#
Click [Traffic] in the Edge Finder to view the data being transmitted from the edge to the intdash server in real time.
Note
Only the data timestamp, ID, type, channel, count, and some payload can be seen here.
Use this function when you want to check the communication between the edge and the intdash server. For data visualization, use Visual M2M Data Visualizer.
5.2.1. Edge traffic screen#
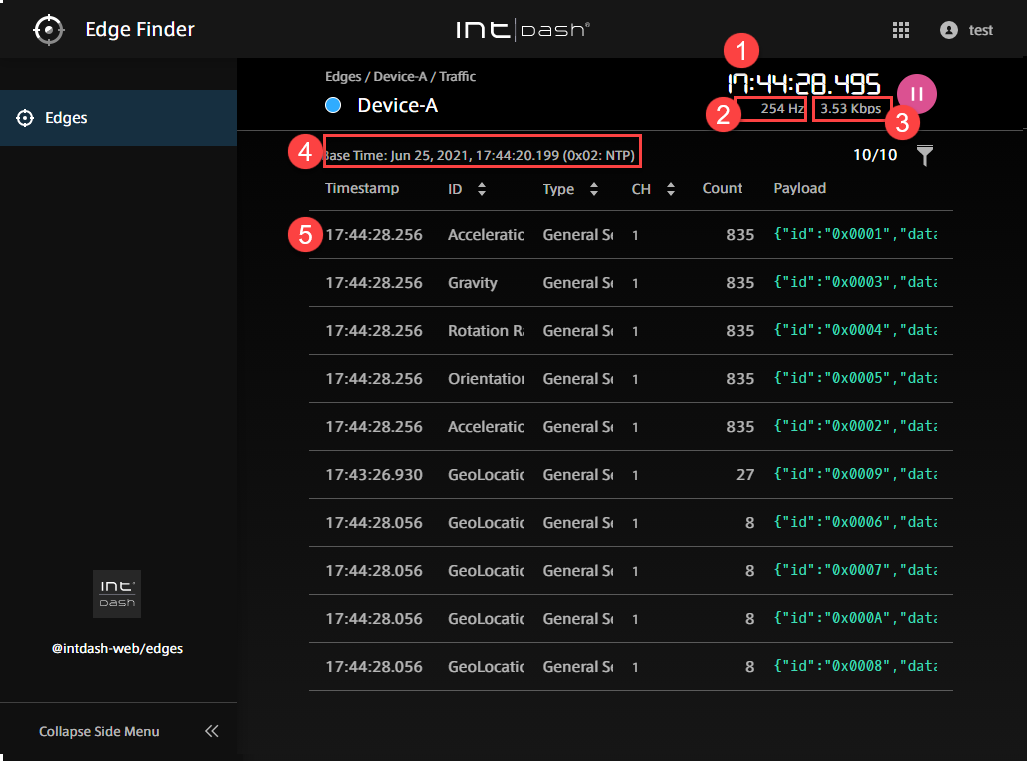
Fig. 13 Traffic screen#
Time (time on the local PC using the browser)
The number of data received from this edge per second (increment of "Count" per second)
The amount of payload received from this edge per second
Measurement start time
Data content
Hint
The "Count" on the traffic screen is the number of data received after the display starts.
You can sort the list by ID, type, or channel.
You can filter by data ID, type, or channel by clicking
 . You can search by AND condition by separating keywords with spaces.
You can pause and play by clicking
 /
/  .
.
Click the line on the traffic screen to display the traffic of that data ID.
5.2.2. Traffic screen by data ID#
On the traffic screen by data ID, up to 50 most recent time-series data of that ID are displayed.
You can view the payload details by opening the details screen.
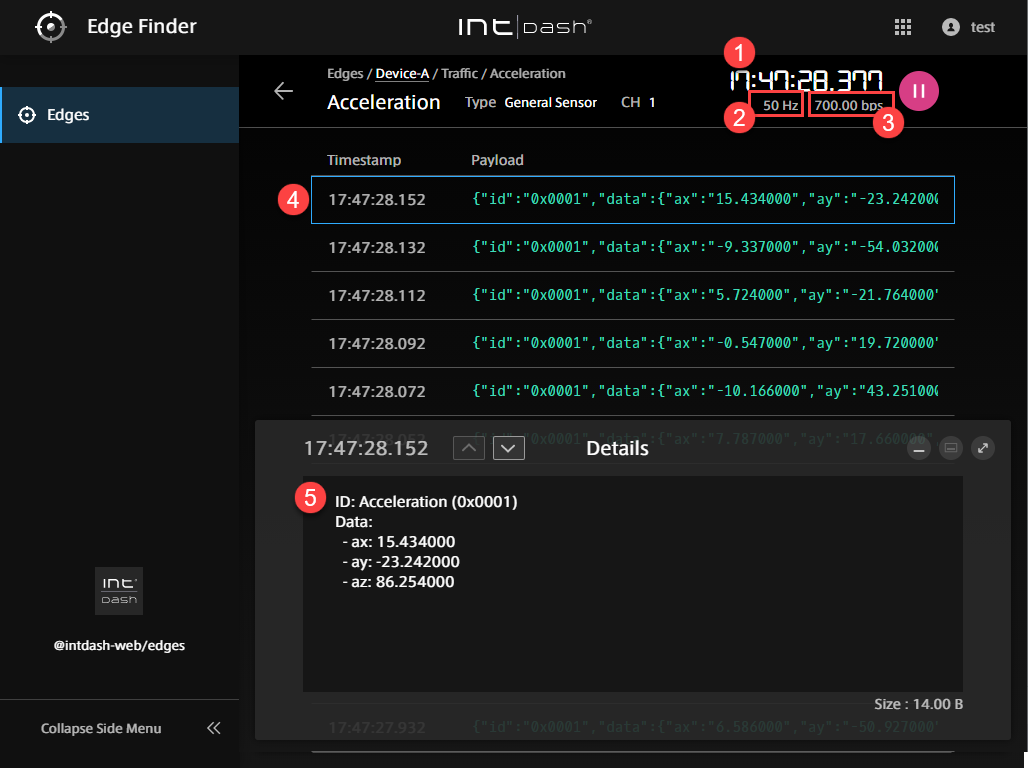
Fig. 14 Payload details#
Time (time on the local PC using the browser)
The number of data received from this edge per second (increment of "Count" per second)
The amount of payload received from this edge per second
Data content
Details
Hint
The display of the detail screen depends on the data type.
If the data includes latitude and longitude, a map will be displayed.
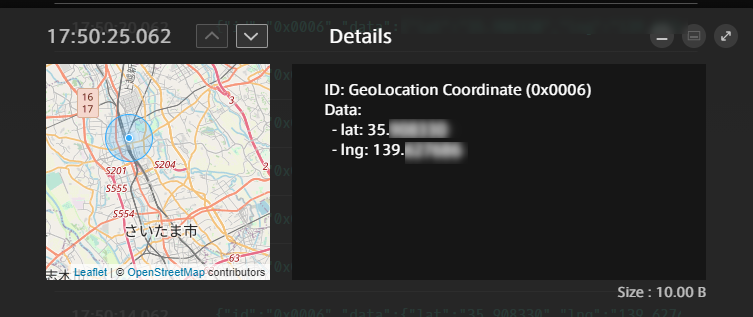
Fig. 15 Latitude and longitude#
If the data type is JPEG, the image will be displayed.
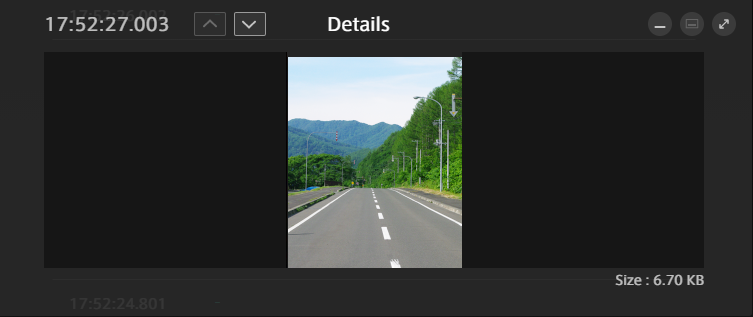
Fig. 16 JPEG#
If the data type is General Sensor, numbers are displayed.
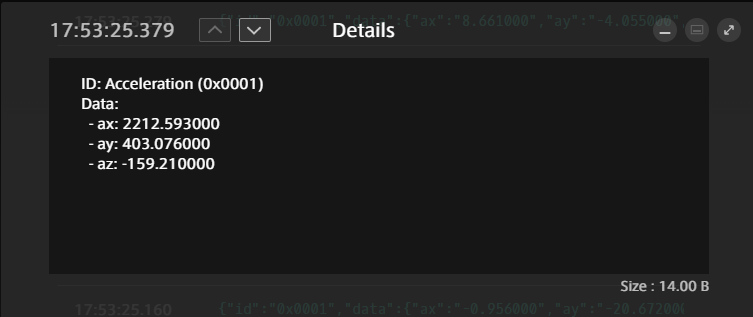
Fig. 17 General Sensor#
For other data types, binary data is displayed as 0s and 1s.
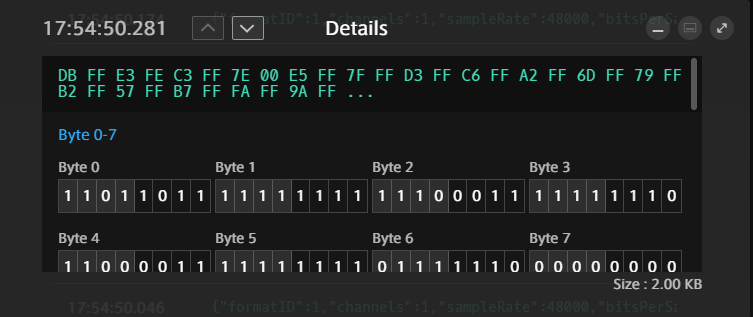
Fig. 18 Binary representation#