1.2. Motion tutorial - Sending acceleration data from an iOS device#
This chapter describes the basic usage of Motion.
As an example, we will use Motion to acquire acceleration data and send it to the intdash server. Then, check the data in real time with Data Visualizer.
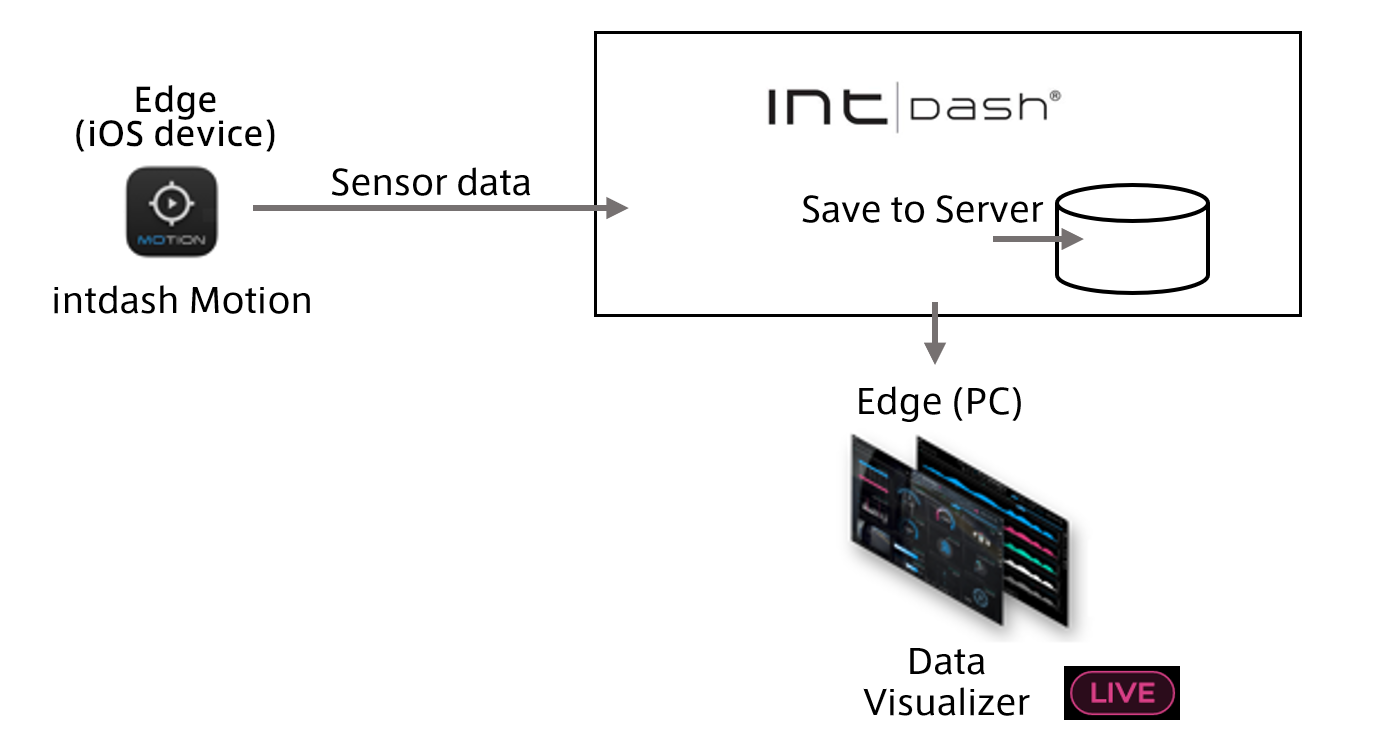
Fig. 39 Tutorial overview#
1.2.1. Install Motion#
Install Motion on your iOS device.
Use the QR code below to open the Motion app page on the App Store.

Alternatively, search for "intdash Motion" in the App Store.
Tap [Get].
1.2.2. Sign in to intdash with Motion#
Launch the Motion application.
When the sign-in screen appears, enter the URL of your intdash server (varies for each customer, e.g.
https://example.vm2m.jp) and tap [Next].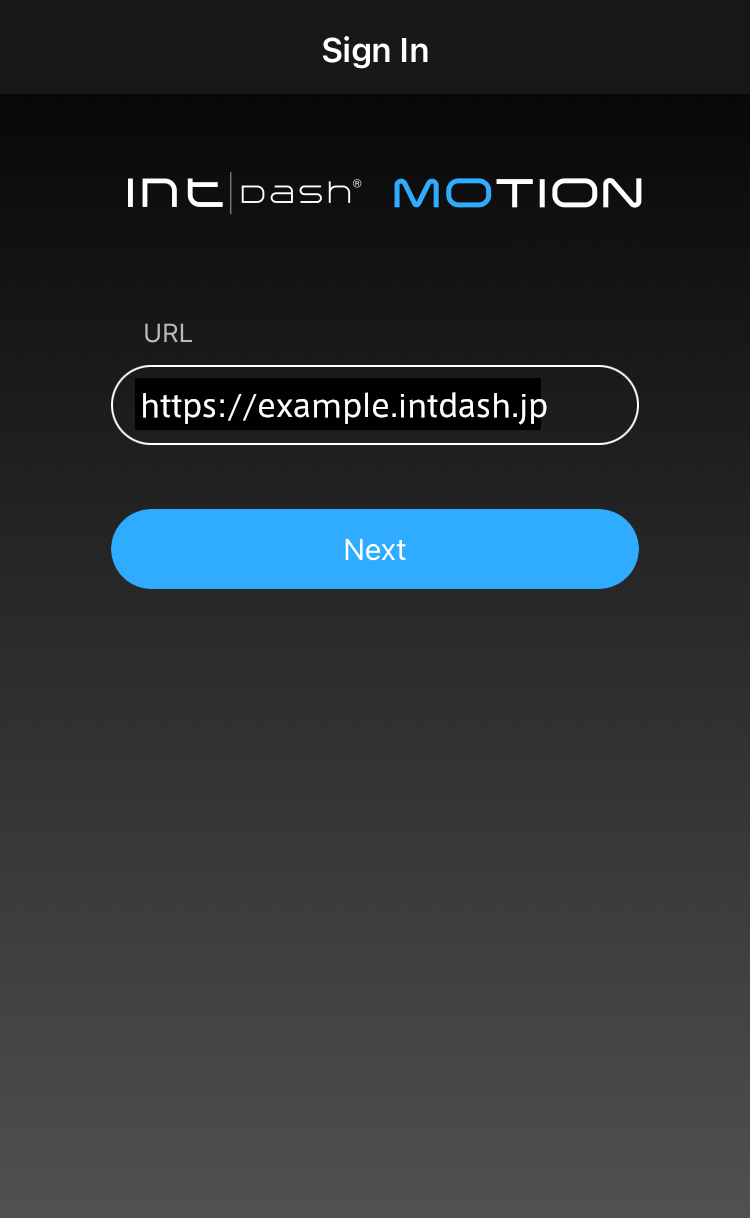
Fig. 40 Enter the URL of the intdash server#
When you see '"Motion" Wants to Use ... to Sign In', tap [Continue].
Enter your user name (or the email address registered in your user account) and password, then tap [Sign In].
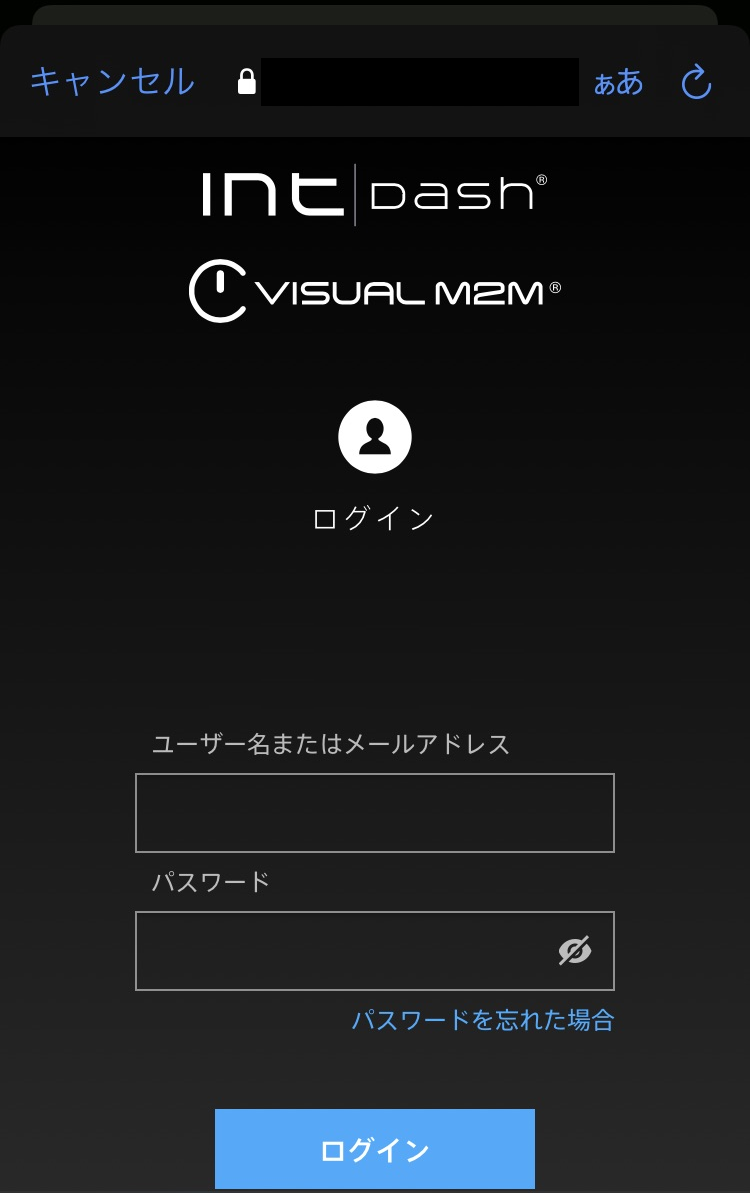
Fig. 41 Sign in#
Note
Use a "user" account to sign in.
If you have only one user account, there is no problem using the same user account for Motion and other applications such as Data Visualizer.
If you have a user account for Motion, separate from the one for the web applications, use it to sign in.
If you wish to use Motion on multiple iOS devices at the same time, please prepare user accounts for the number of devices.
The time series data is saved in association with the edge from which the data was obtained.
Although you sign in to Motion using your user account, the time-series data retrieved is treated as data from the "edge with the same name as the user". For example, if you acquire data as user "user1", the data will be sent to the intdash server as data from the edge named "user1".
When you're prompted for permission to use your location, tap "Allow While Using App". (Please note that if you tap [Don't allow] here, you will not be able to send GPS data.)
When prompted for access to the microphone and camera, tap [OK] for each.
If you sign in successfully, the measurement start screen will be displayed.
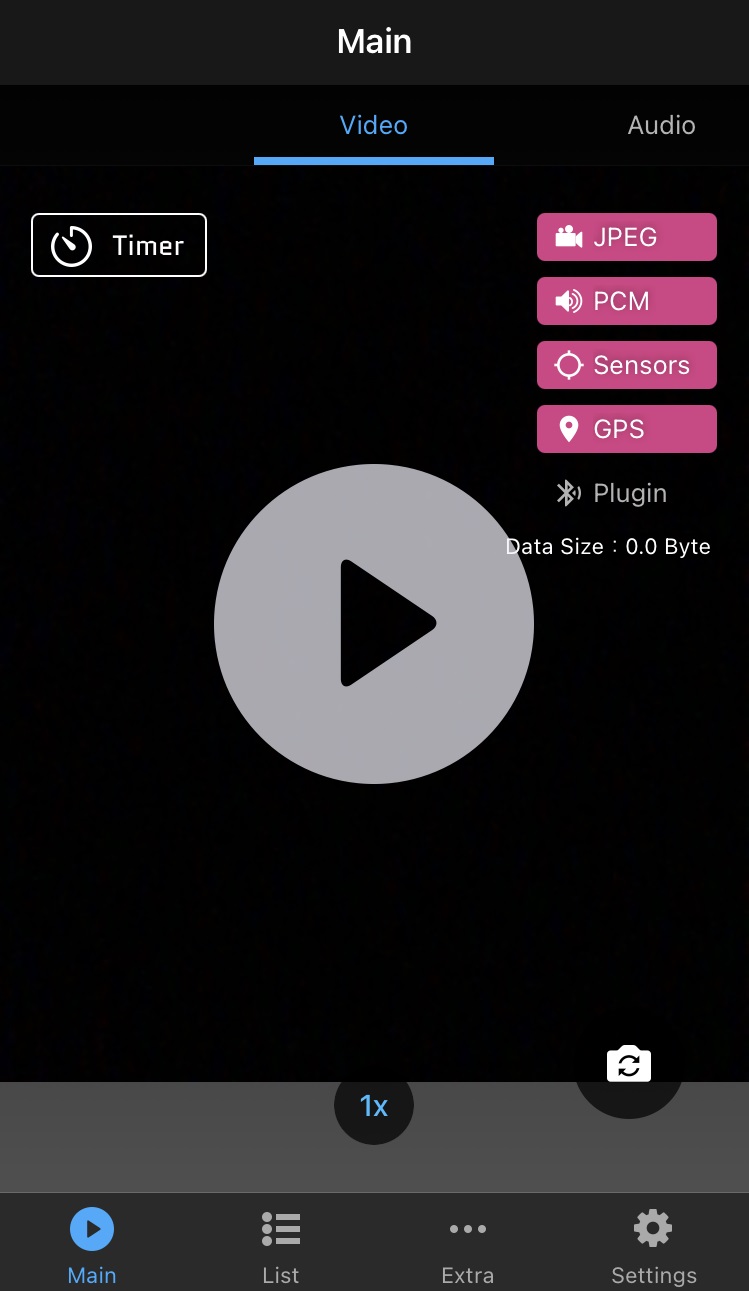
Fig. 42 Measurement start screen#
1.2.3. Configure settings for data to be sent#
Set what data to send to the intdash server. In this tutorial, we will configure it to send accelerometer values as an example.
In Motion, tap [Settings].
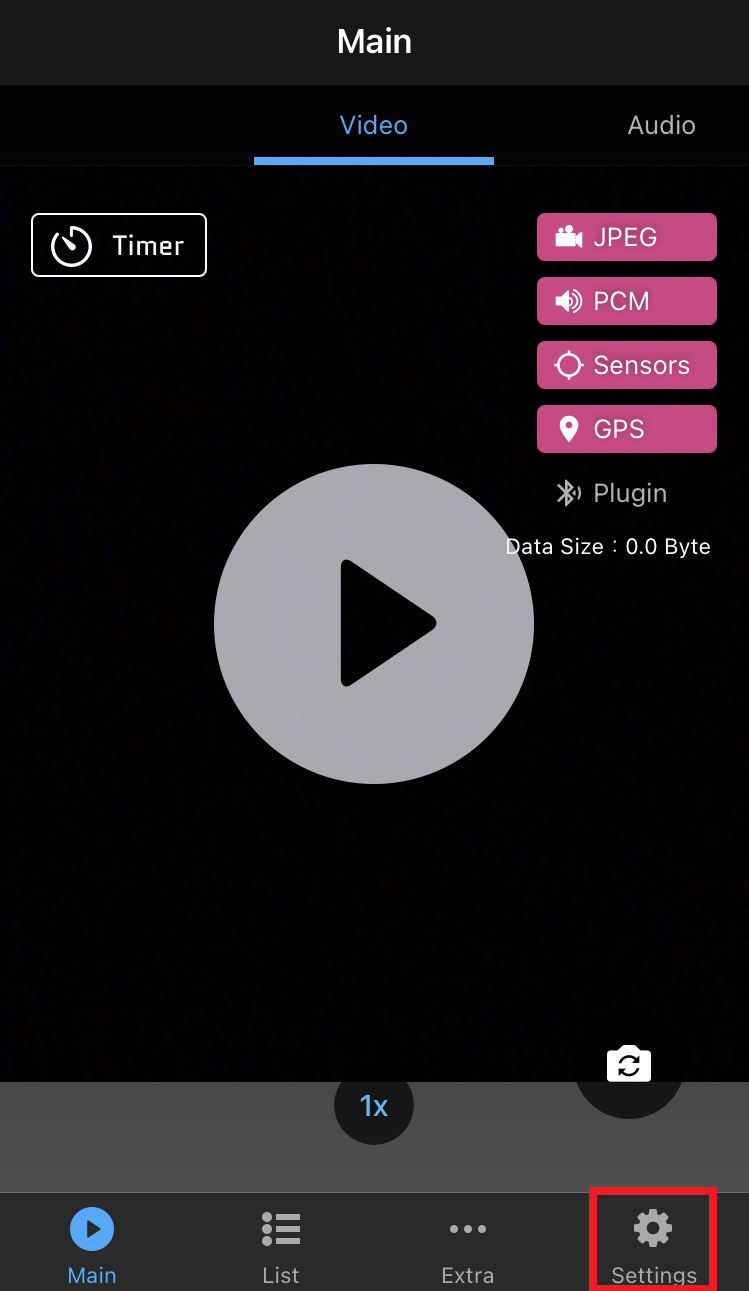
Fig. 43 Open the settings screen#
Turn on [Sensors].
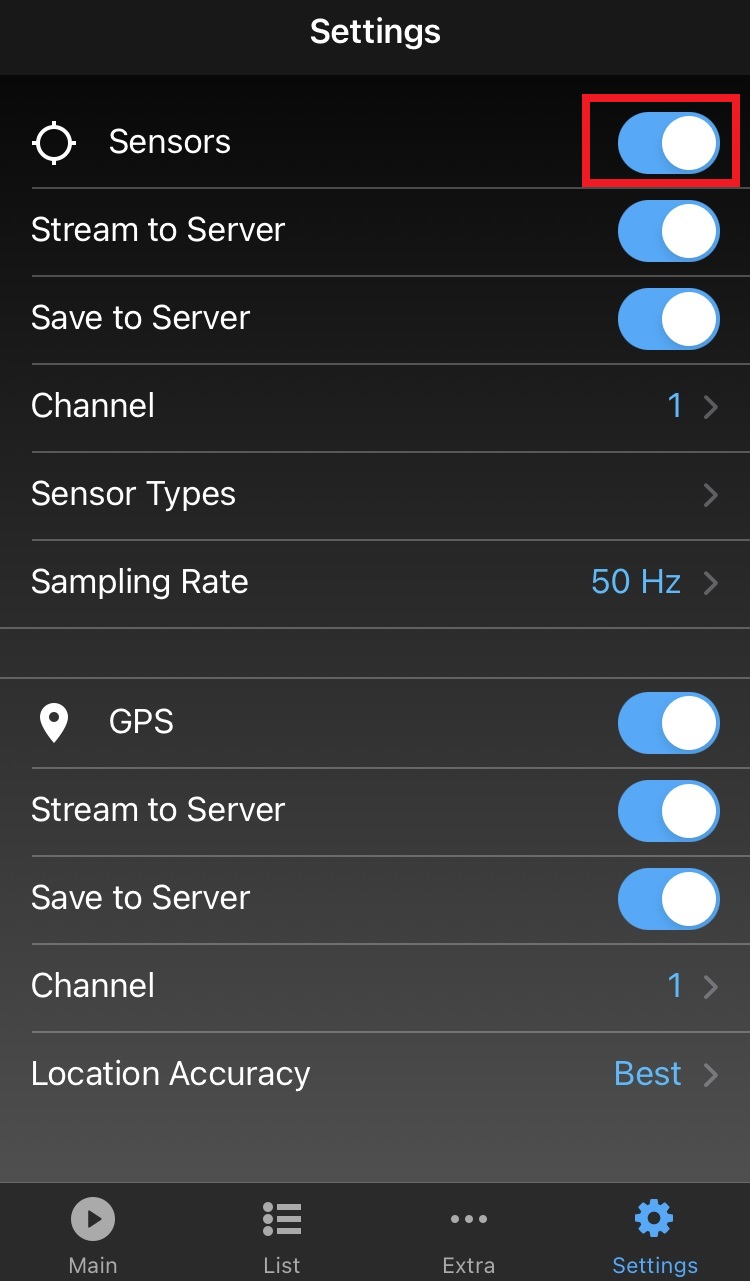
Fig. 44 GPS setting screen#
Set as follows.
Stream to Server: On
Save to Server: On
Channel: 1
Sensor Types > Acceleration: On
Note
When [Save to Server] is turned on, all data sent by the iOS device will be saved on the server. If you do not want to save data to the server, turn [Save to Server] off.
1.2.4. Set up Data Visualizer#
Prepare Data Visualizer to display data.
1.2.4.1. Sign in to view the Data Visualizer#
Open the Data Visualizer application in your Chrome web browser (URL is different for each customer, e.g.
https://example.vm2m.jp/vm2m/).When the sign-in screen is displayed, enter the user name (or the email address registered in the user account) and password, and then click [Sign In].
The Data Visualizer is displayed.
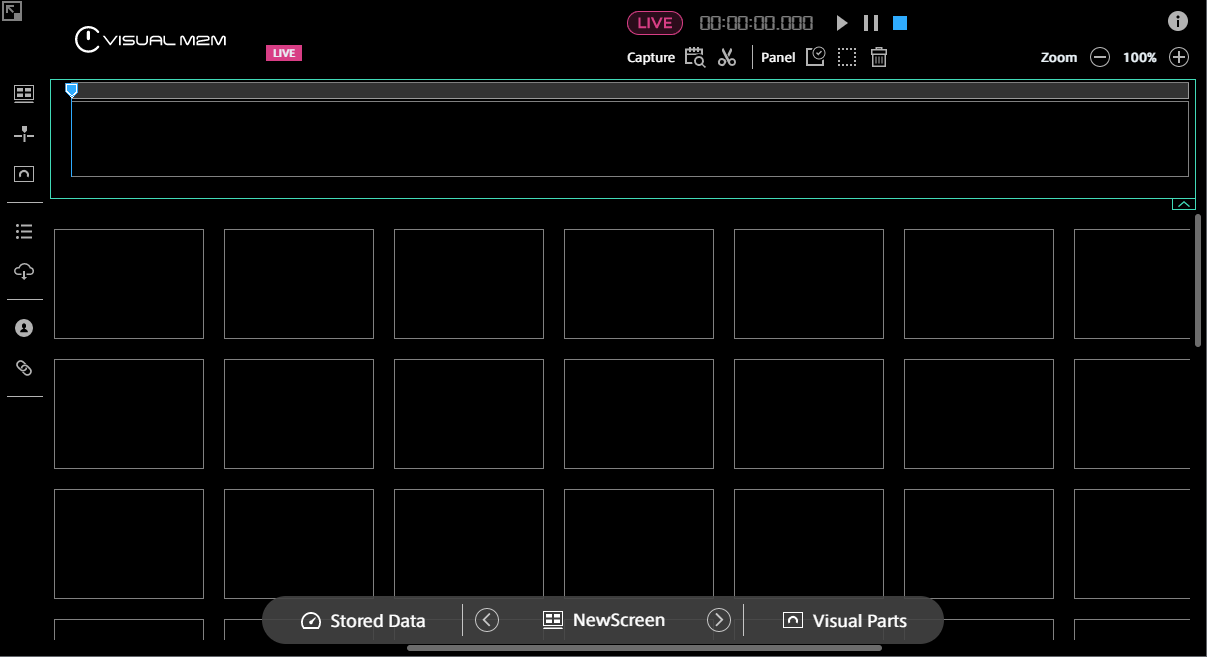
Fig. 45 Data Visualizer#
1.2.4.2. Import a data settings (.dat) file to display the data#
Get the data settings file from the dedicated download page in order to view data from iOS devices.
Click Links (
 ) on the left side of the Data Visualizer screen.
Click [Download DAT File]. A list of downloadable DAT files (files in .dat format) is displayed.
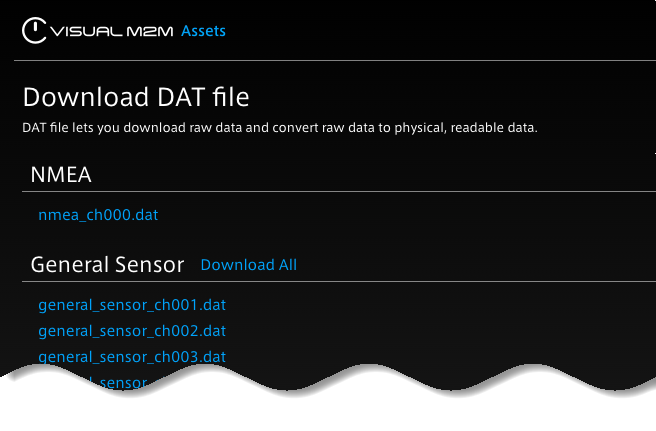
Fig. 46 List of DAT files#
Download the following DAT file.
General Sensor >
general_sensor_ch001.datOn the left side of the Data Visualizer screen, click [Data Settings] (
 ) > [Add Group]> [Import] to import the DAT file.
This completes the import of the data settings file.
1.2.4.3. Place visual parts on the screen#
Click any empty panel and select [2 x 2].
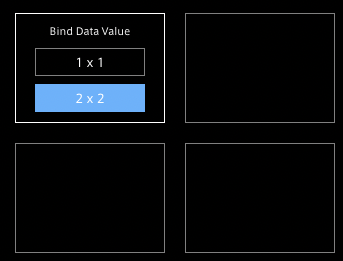
Fig. 47 Select a panel#
Select [Line Graph] as the visual part.
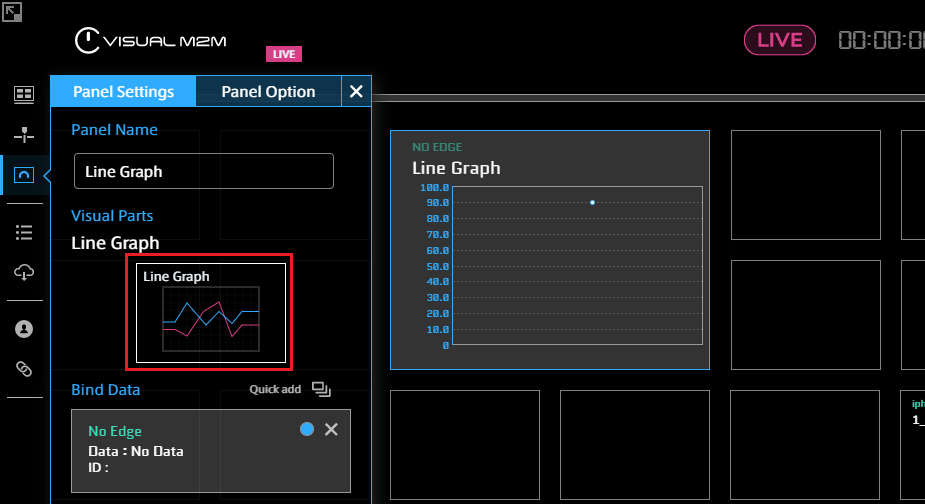
Fig. 48 Select Line Graph#
Select the data source you want to visualize. In this tutorial, we will visualize the data acquired by Motion, so select the username you used to sign in with Motion.
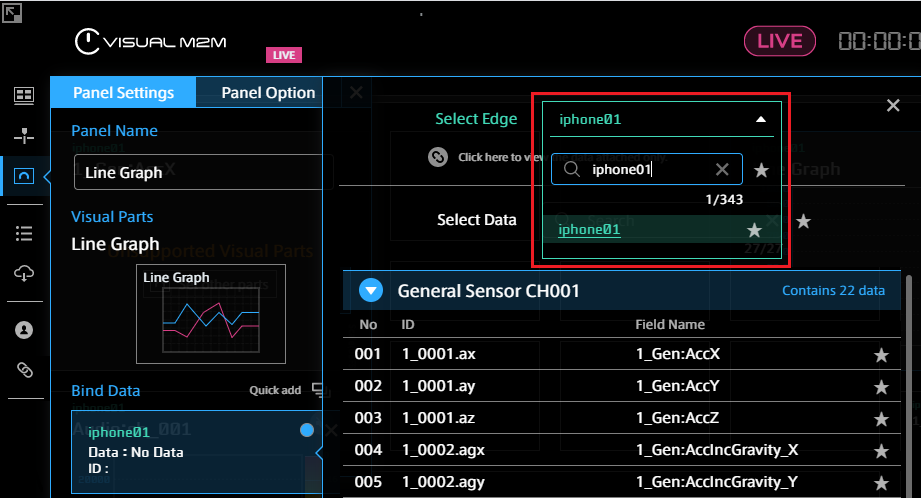
Fig. 49 Select an edge#
Select "1_0001.ax" (acceleration in the X-axis direction) as the data to be visualized.
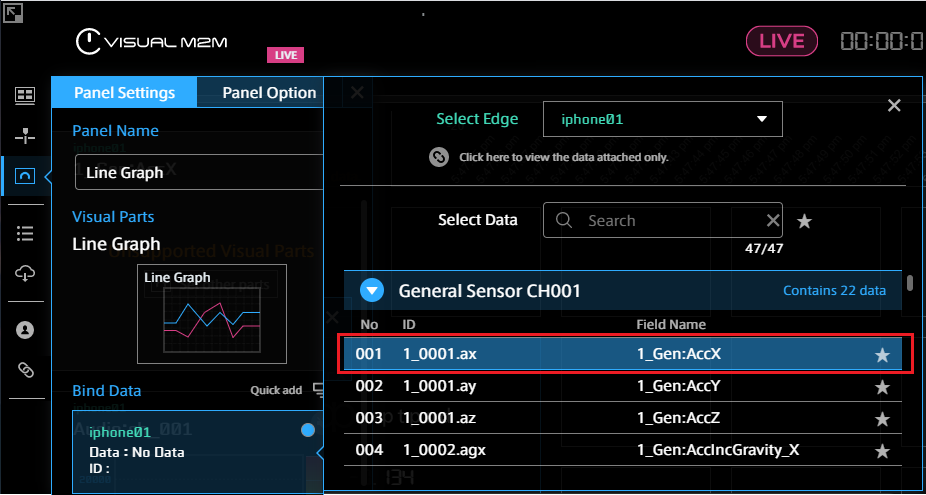
Fig. 50 Bind acceleration data#
1.2.5. Start measurement and visualize data#
After setting up Motion and Data Visualizer, send the data from the iOS device to intdash.
Put the Data Visualizer in live mode for real-time visualization. If you see the pink live mode icon (
 ), you are currently in live mode. If you see a gray icon (
 ), click the icon to switch to live mode.
Fig. 51 Live mode display#
Tap
 in the center of the Motion Main screen to start the measurement.
Click the play button
in Data Visualizer. The data sent from your iOS device is displayed on the dashboard.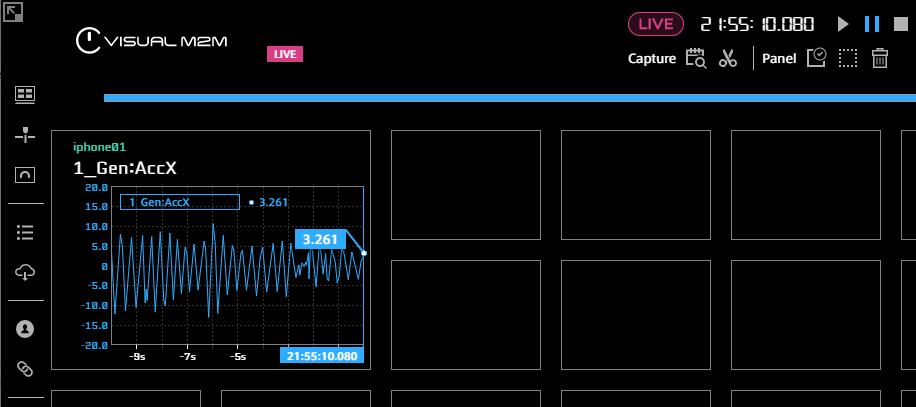
As you shake or move your iOS device, you can see that the value displayed in the Data Visualizer fluctuate.
Tap ■ in Motion to end the measurement.
This completes one measurement. The measurement data from tapping
to tapping ■ in Motion is saved in the server as one measurement.
This completes the measurement and visualization of acceleration with Motion.
In addition to acceleration, Motion can acquire various sensor data, video, audio, and GPS data. See Acquire data with Motion for settings to retrieve these data.
Note
Pressing and holding (long tap) the Main screen will lock the screen to prevent accidental operation. To unlock the screen, press and hold the screen again.
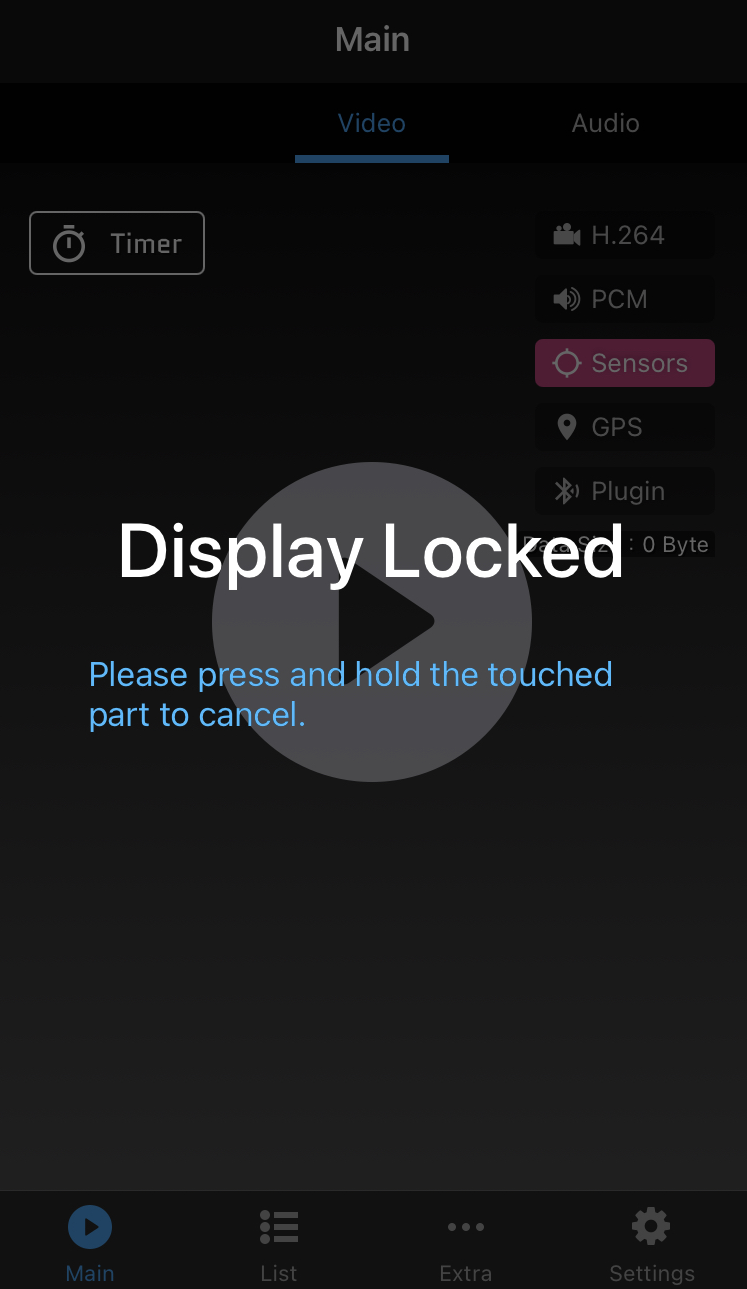
Fig. 52 Locked screen (Press and hold the screen to unlock.)#