16. How to use visual parts#
16.1. Map#
16.1.1. Google Maps and Open Street Map#
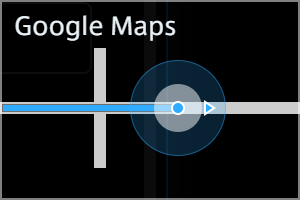
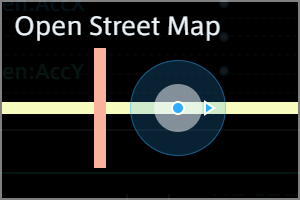
There are two visual parts that display a location on a map using latitude and longitude data: Google Maps and Open Street Map.
The difference between Google Maps and Open Street Map in Data Visualizer is as follows.
Google Maps |
Open Street Map |
|
|---|---|---|
Map data |
Map data provided by Google |
By default, map data provided by Open Street Map tile server ( |
Switching Map Types |
You can switch between several map types (Satellite, Dark, etc.) by mouse operation. |
Various maps provided in Open Street Map format can be used by changing the settings of the map data source (tile server) in Panel Settings. |
API key to use the map data |
For intdash servers operated by aptpod, no API key setting is required. If you are running your own intdash server, you will need to set up an API key (refer to the document on building an intdash server for instructions). |
Default maps can be used without an API key. If you want to use map data that requires an API key, enter the URL that contains the API key when setting the source (tile server) of the map data. |
16.1.1.1. Data to be bound to Google Maps or Open Street Map#
You can bind latitude, longitude, direction, and other data to a Google Maps or Open Street Map visual part. Latitude and longitude are required, the others are optional.
Binding latitude and longitude will display the location on the map.
Binding the direction will display the direction of the edge on the map.
Binding any other data will display the value (only one) in a callout on the map.
16.1.1.1.1. Latitude, longitude, and direction#
If the Data ID (or Data Name) of the bound data contains specific keywords, it is recognized as data representing latitude, longitude, or direction, and is used to display the position on the map.
The keywords are as follows. For example, if the Data ID or Data Name contains the keyword "LAT," it is recognized as latitude.
Latitude: LAT
Longitude: LNG or LON
Direction: HEAD or DIRECTION
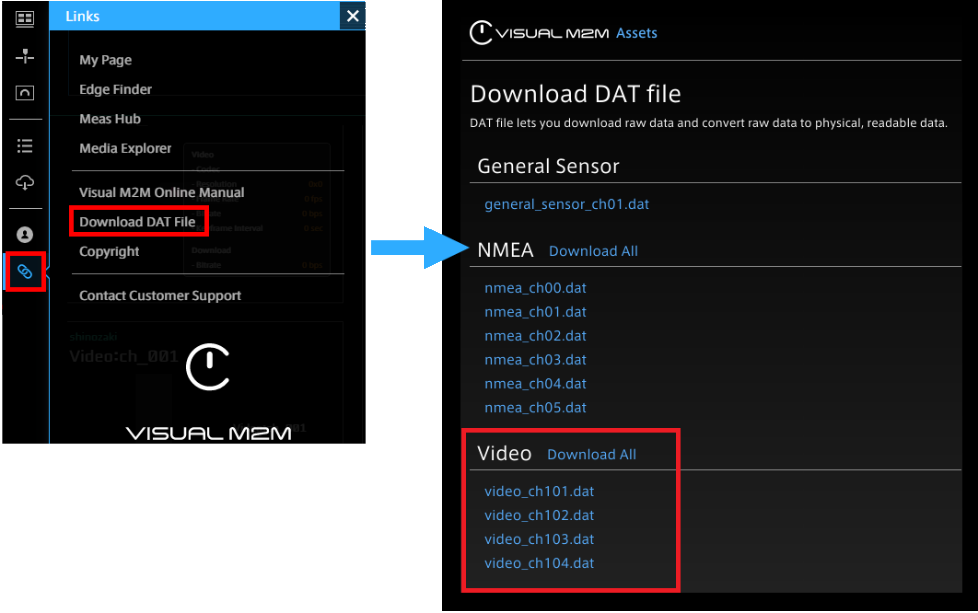
If you use the data settings for NMEA or General Sensor downloaded from [Links] > [Download DAT File], bind the following data. (In the downloaded data settings, "x" is the channel number.)
Latitude |
Longitude |
Direction |
|
|---|---|---|---|
NMEA (GPS) |
x_RMC_Lat |
x_RMC_Lng |
x_RMC_Direction |
GeneralSensor (Smartphone) |
x_Gen:Lat |
x_Gen:Lng |
x_Gen:Head |
16.1.1.1.2. Other data#
You can also bind data other than latitude, longitude, and direction. The first data except latitude, longitude, and direction is displayed in a box on the map.
16.1.1.2. Example of setting and display#
In the following example, latitude (Lat), longitude (Lng), and direction (Head) are bound to the map. Other than those, speed (Speed) and altitude (Alt) are bound to the map but only the first data (speed) is displayed in a callout box on the map.
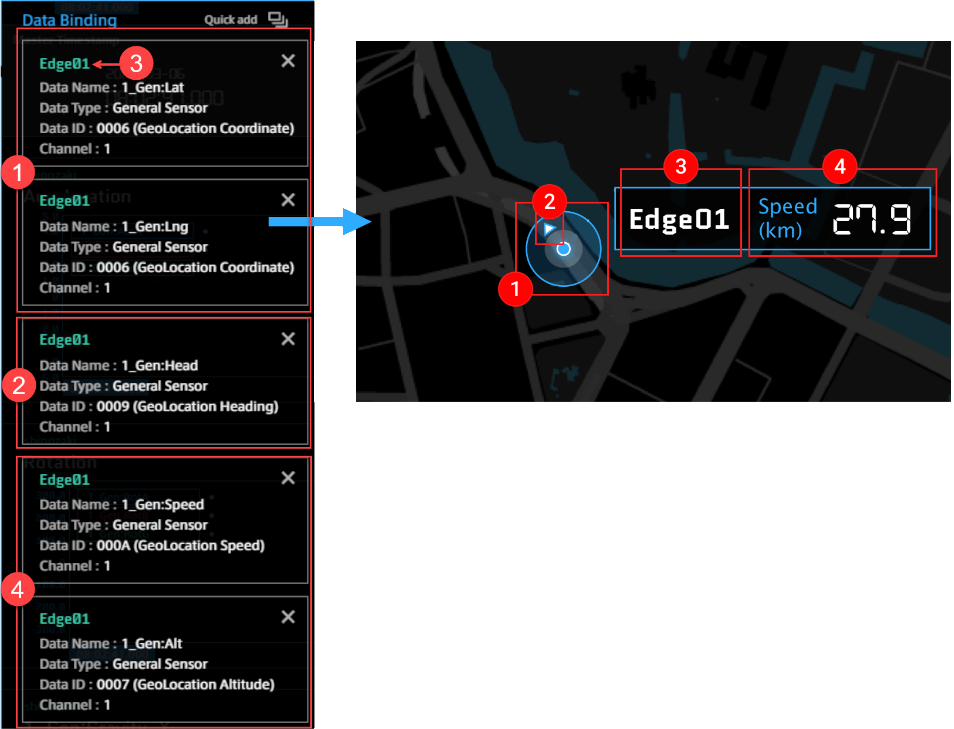
 Edge location (latitude, longitude),
  Edge direction,
  Edge name, and
  Other data
Note
If no edge is displayed on the map
Confirm that the latitude and longitude data are set.
Confirm that the data and measurement edge channels are the same. If they are different, the edge cannot be displayed.
Make sure the edge and Data Visualizer are both communicating with the server.
16.1.2. Window operation#
When you mouse over the map panel, a list of operation icons appears at the bottom right of the panel.
Icon |
Operation |
|---|---|

(Google Maps only) |
Click to select the Map Type (Satellite, Dark, etc.). |

|
When this is set to ON, the trajectory is displayed. 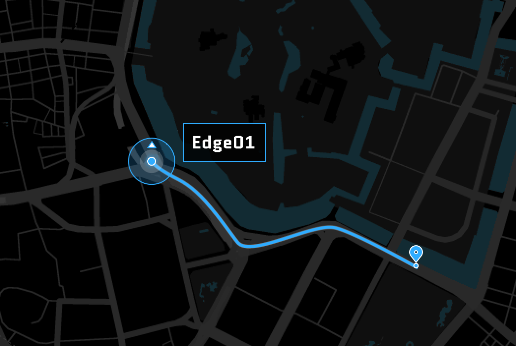
|

|
Changes the edge displayed at the center of the window. Displays all edges, or focuses on a particular edge. |

|
Zoom in/out on the map. |

|
When this is set to ON, the map is displayed in full screen on the back of the screen. When this is set to OFF, the map is displayed in the panel. |
16.1.3. Panel Settings#
Setting item |
Required / Optional |
Settings |
|---|---|---|
Panel Name |
Optional |
Enter the name to be displayed on the panel. |
Bind Data |
Required |
16.1.4. Panel Option#
Setting item |
Required / Optional |
Settings |
|---|---|---|
Threshold |
Optional |
When turned on, if the data displayed in the callout box exceeds the threshold, the trajectory turns red. For more information on setting the threshold, refer to Setting the display format (Display Settings). 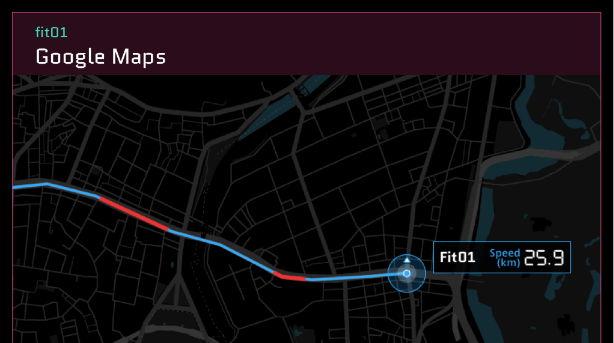
|
Custom Tile Server URL (Open Street Map only) |
Optional |
To change the source of the map data, enter the tile server URL, including variables such as {x}, {y}, and {z} in the URL. Example: If not specified, the default tile server URL |
Custom Copyright Attribution (Open Street Map only) |
Optional |
Enter the credit you want to display in the lower right corner of the map. HTML can be used. Example: If not specified, the default tile server credentials will be used. 
|
16.2. Media (Video and audio)#
16.2.1. Video Player (for H.264) and Image Viewer (for Motion JPEG)#
Video Player and Image Viewer display video. Use the appropriate visual parts for the codec of the video.
Use Video Player for H.264.
Use Image Viewer for Motion JPEG (MJPEG).
To display video, the data setting for video (data type "VIDEO(H.264,JPEG)") is required.
Download and import a settings file (.dat) or create settings on the Data Settings screen. If you download the settings, be sure to download data settings for the correct channel. For example, the settings file for channel 1 is video_ch001.dat.
The same data settings can be used for H.264 and Motion JPEG.
Note
Set up visual parts and channels correctly
All of the following must be done correctly to display video.
Use Video Player for H.264 and Image Viewer for Motion JPEG.
Use data settings for the correct channel
Bind correct data
16.2.1.1. Operation of Video Player and Image Viewer#
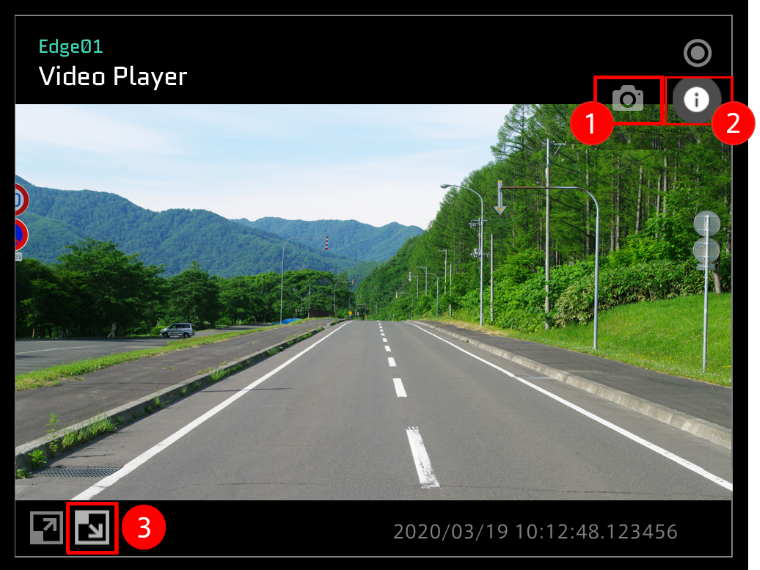
Downloads the currently displayed image as a still image file. The file will be saved in the resolution of the original data, regardless of the current display size.
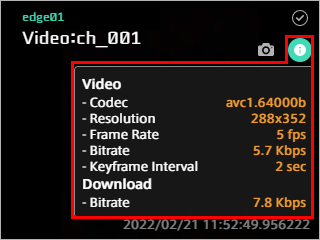
(Video Player only) Displays information about the video, where Bitrate in Video indicates the bit rate of the video at the time it was shot, and Bitrate in Download indicates the bit rate at which the Data Visualizer is currently downloading the video from the intdash server.
Displays this video as the background of the dashboard. Click the same button again to return to the original view.
Note
Aspect Ratio
The visible area of the video is affected by the aspect ratio of the panel. Adjust the panel size according to the ratio of the video. For details on panel size, see Changing the panel size.
Note
Downloading video
Videos acquired with H.264 codec can be downloaded from the measurement details screen of the Meas Hub application. In this case, the video is downloaded as an MP4 file and does not contain any audio or timestamp by intdash.
16.2.1.2. Panel Settings#
Setting item |
Required / Optional |
Settings |
|---|---|---|
Panel Name |
Optional |
Enter the name to be displayed on the panel. |
Bind Data |
Required |
Select the data source (edge) and the data you wish to display (data type "VIDEO(H.264,JPEG)"). |
Rendering Speed |
Required |
The update frequency. Default is 20 fps. Increasing the Rendering Speed increases the processing load. If the processing load is too high, the panel may not be updated at the specified frequency. During LIVE playback, the Rendering Speed of the Image Viewer cannot be changed. |
16.2.1.3. Panel Option#
Setting item |
Required / Optional |
Settings |
|---|---|---|
Time Offset or Start Time Offset |
Optional |
Playback start time can be adjusted. If the time of the video is out of sync with other data, you can offset the video to align it with other data (Minimum unit: 0.01s). |
Hardware Acceleration |
Optional |
(Video Player only) Specifies whether hardware acceleration is used for video playback.
Hardware acceleration may enable smoother video playback, but the effect depends on the video to be played back and the performance of the PC. |
Show Video info on Panel |
Optional |
(Video Player only) When turned on, information about the video is displayed on the panel. |
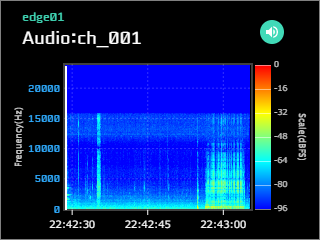
16.2.2. Audio Player#
Audio Player plays audio and displays a spectrogram.
To playback audio, data settings for audio (data type "AUDIO(PCM,AAC)") are required.
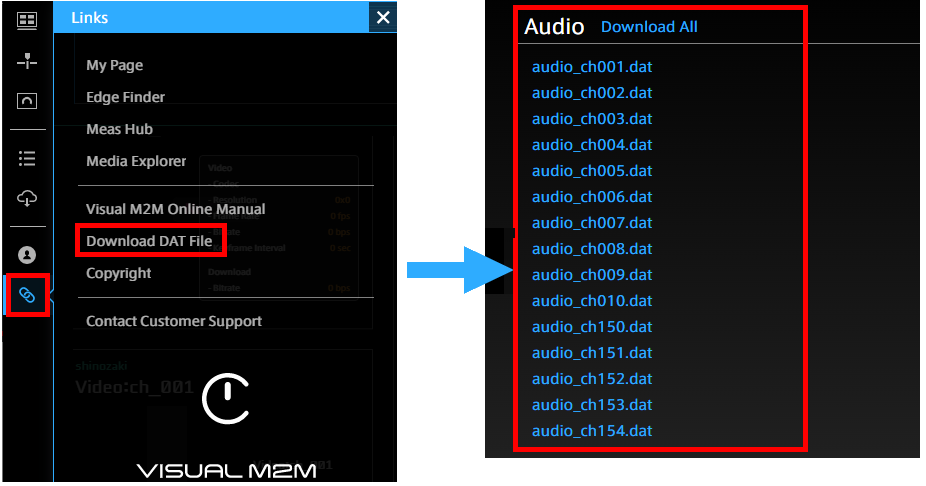
Download and import a settings file (.dat) or create settings on the Data Settings screen. If you download the settings, be sure to download the data settings for the correct channel. For example, the settings file for channel 1 is audio_ch001.dat.
Operating the Audio Player
Click  to mute/unmute audio.
16.2.2.1. Panel Settings#
Setting item |
Required / Optional |
Settings |
|---|---|---|
Panel Name |
Optional |
Enter the name to be displayed on the panel. |
Bind Data |
Required |
Select the data source (edge) and the data you wish to display (data type "AUDIO(PCM,AAC)"). |
Rendering Speed |
Required |
The update frequency. Default is 20 fps. Increasing the Rendering Speed increases the processing load. If the processing load is too high, the panel may not be updated at the specified frequency. This setting is for the spectrogram and does not affect the audio played back. |
16.3. Graph#
16.3.1. Line Graph#
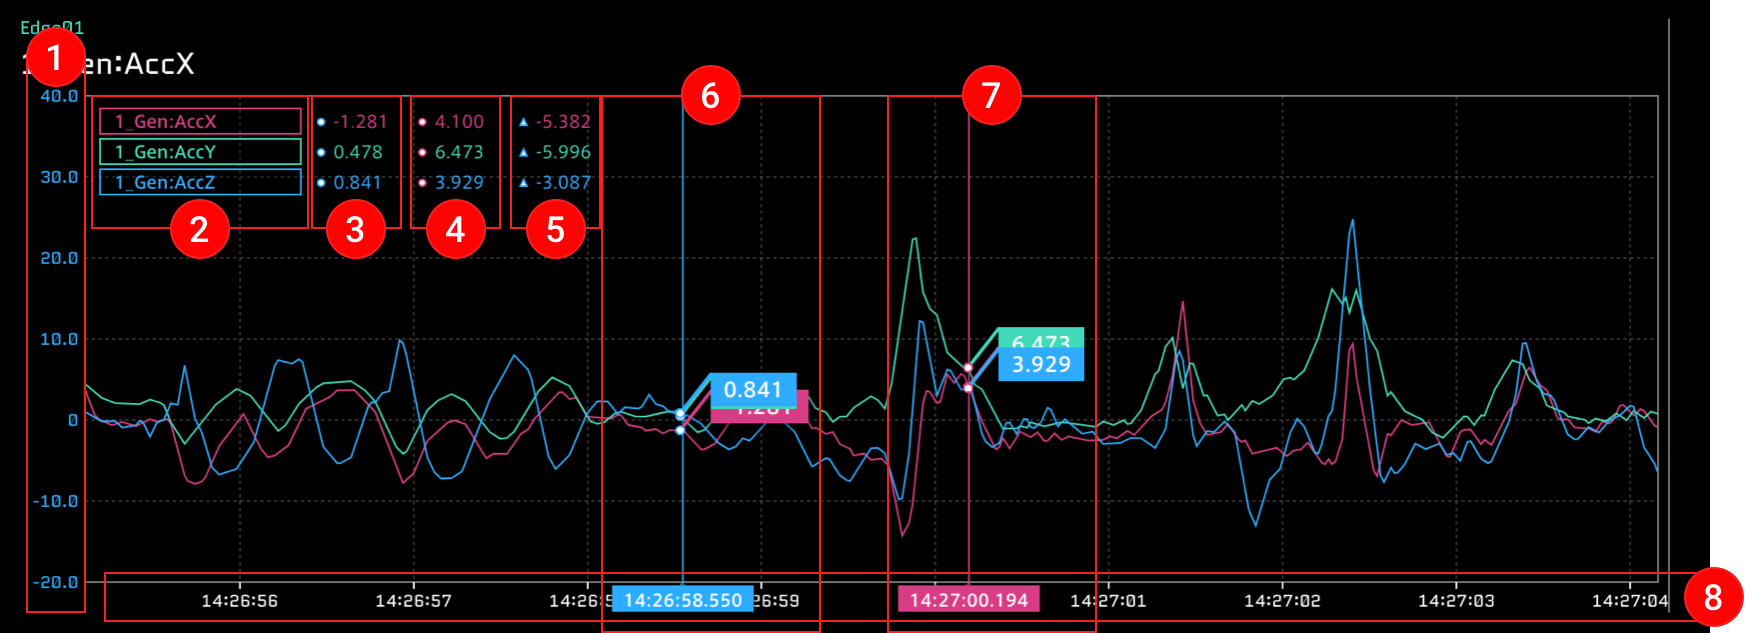
16.3.2. Description of the window#
* Up to 10 data items can be bound.
The vertical axis that represents the data value. This can be set with the [Data Range] item in the Panel Option window.
Field name of the data. You can click these items to show or hide the data. For details, see Showing or hiding data
Value of Current Position.
Value of Compared Position.
 Difference value obtained by subtracting the value of Compared Position from the value of Current Position.
 Current Position (instantaneous value).
 Compared Position (comparison position).
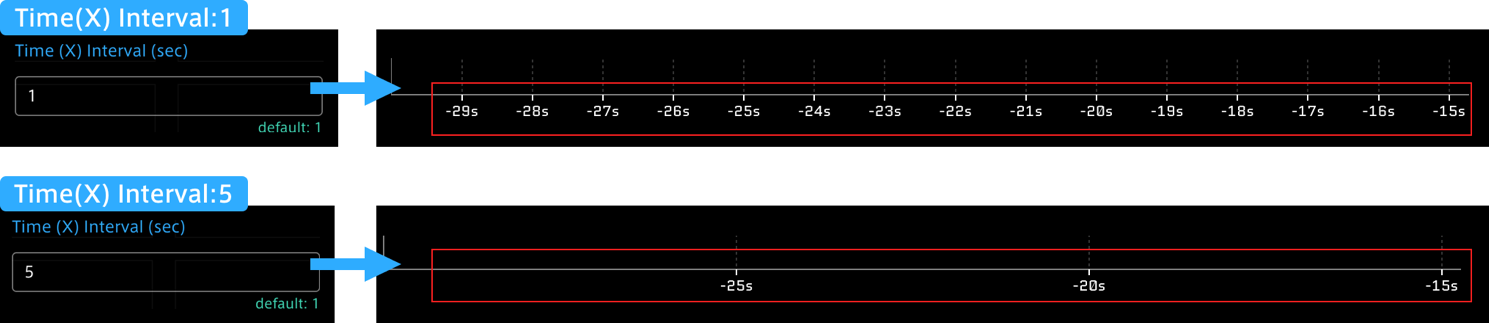
 The horizontal axis that represents time. This can be set with the [Time (X) Interval] item in the Panel Option window.
16.3.3. Panel Option#
Setting item |
Required / Optional |
Settings |
|---|---|---|
Data Range |
Optional |
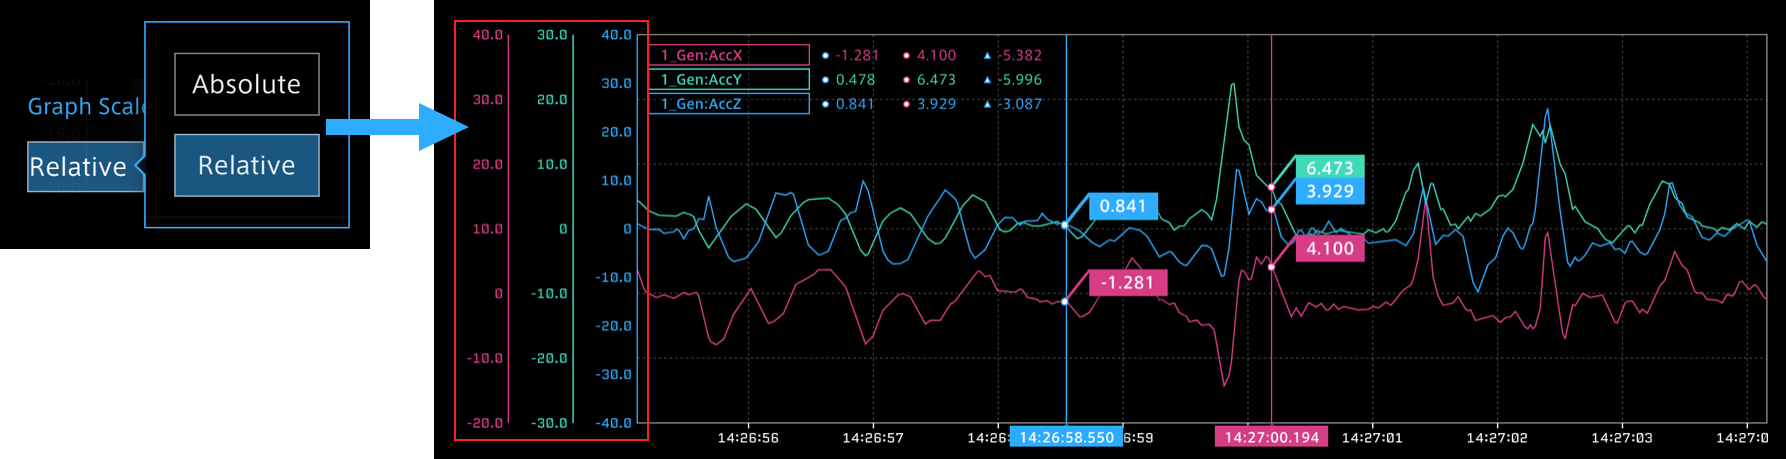
Set the maximum and minimum values of the vertical axis. Multiple scales can be displayed on the left scale only when [Relative (relative display)] is set in the [Graph Scale] item. |
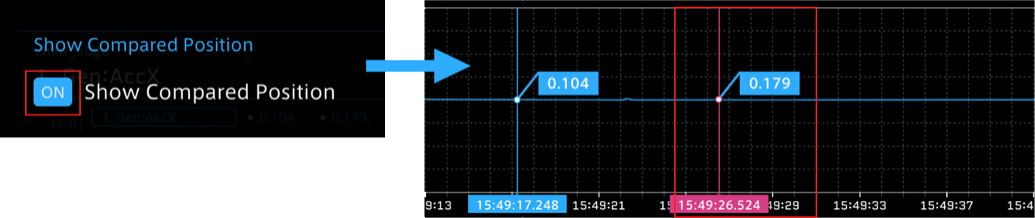
Show Compared Position |
Optional |
ON: Compared Position is displayed. |
Setting item |
Required / Optional |
Settings |
|---|---|---|
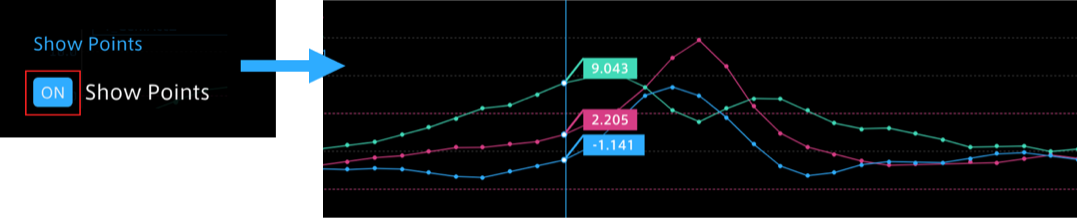
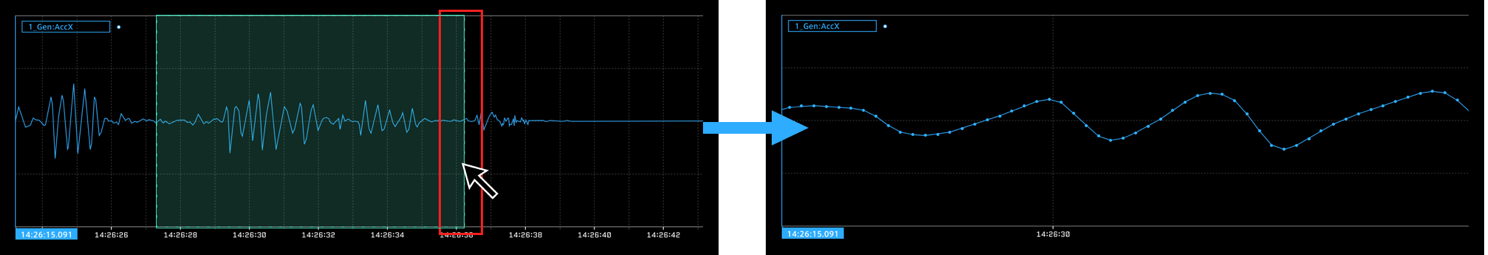
Show Points |
Optional |
ON: Sampling points are displayed when the display range is specified. They are not displayed if the display range is too wide. |
Setting item |
Required / Optional |
Settings |
|---|---|---|
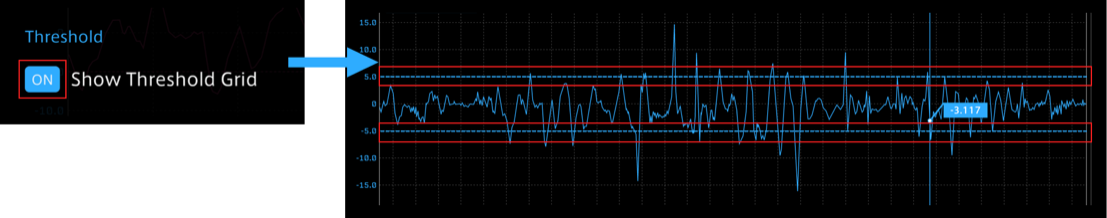
Threshold |
Optional |
ON: The threshold grid set for data is displayed. |
Setting item |
Required / Optional |
Settings |
|---|---|---|
Time (X) Interval (sec) |
Optional |
Set the interval for the horizontal axis. |
Setting item |
Required / Optional |
Settings |
|---|---|---|
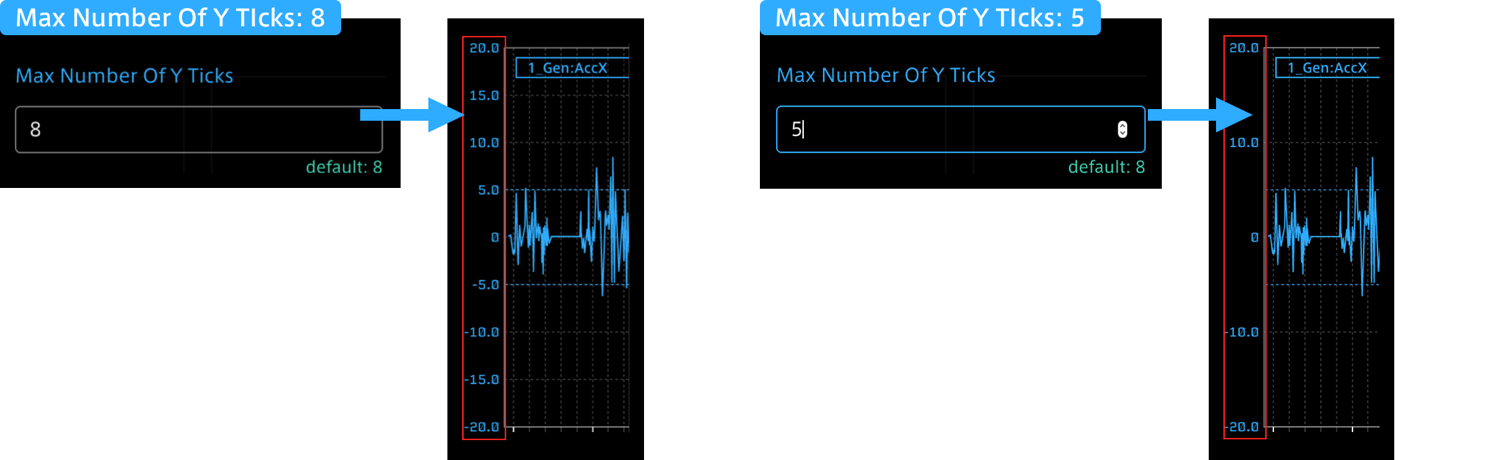
Max Number of Y Ticks |
Optional |
Maximum number of scales on the vertical axis. The default value is 8. |
Setting item |
Required / Optional |
Settings |
|---|---|---|
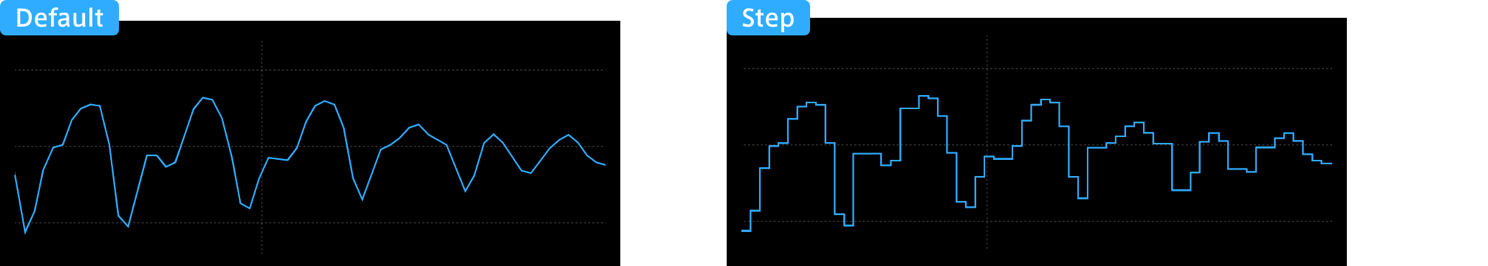
Graph Interpolation |
Optional |
Set the data interpolation method. Default: Line graph Step: Stepped graph |
Setting item |
Required / Optional |
Settings |
|---|---|---|
Graph Scale |
Optional |
Set the display scale of the graph. Absolute: Absolute value display. All data items are displayed on the same scale. Relative: Relative display. The Y axis for each data item is displayed, and the graph is drawn using its own scale. |
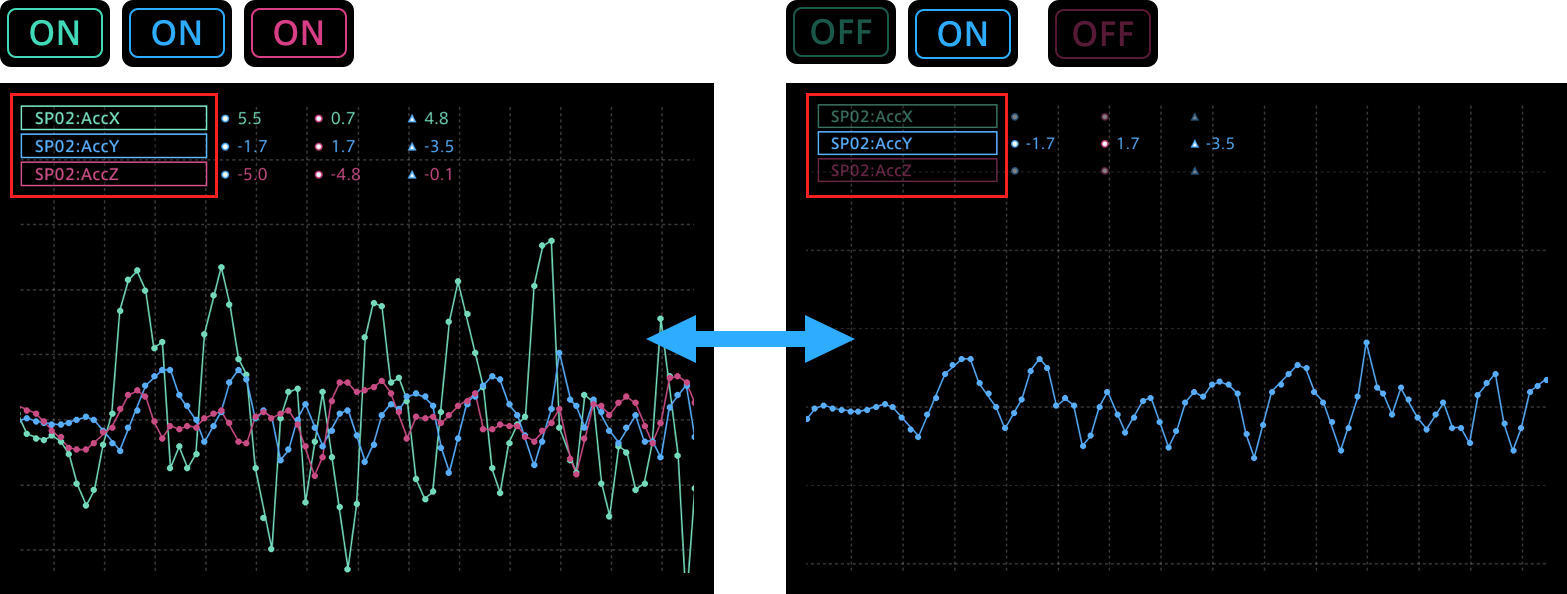
16.3.4. Showing or hiding data#
When multiple data items are bound, the line graphs are displayed for all the data items. You can show or hide line graphs by clicking Field Name of each data item. The Field Name for a hidden data item is paled out.
16.3.5. Narrowing the display range of Line Graph#
Operation on the graph
Click anywhere in the graph display area, and then drag it to the right or left.
Operation on the timeline
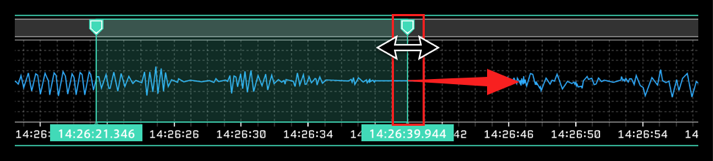
To return to the whole graph display, cancel the range specification by using the  button in the menu displayed in the upper right when hovering the mouse over the green cursor (timeline).
For details, see Specifying the timeline range.
16.3.6. Scatter#
Scatter displays a scatter plot. Bind two data items to one scatter plot.
If you specify the display range by dragging on the timeline, the scatter plot is displayed only with the data in the specified range. For details about specification of the timeline range, see Specifying the timeline range.
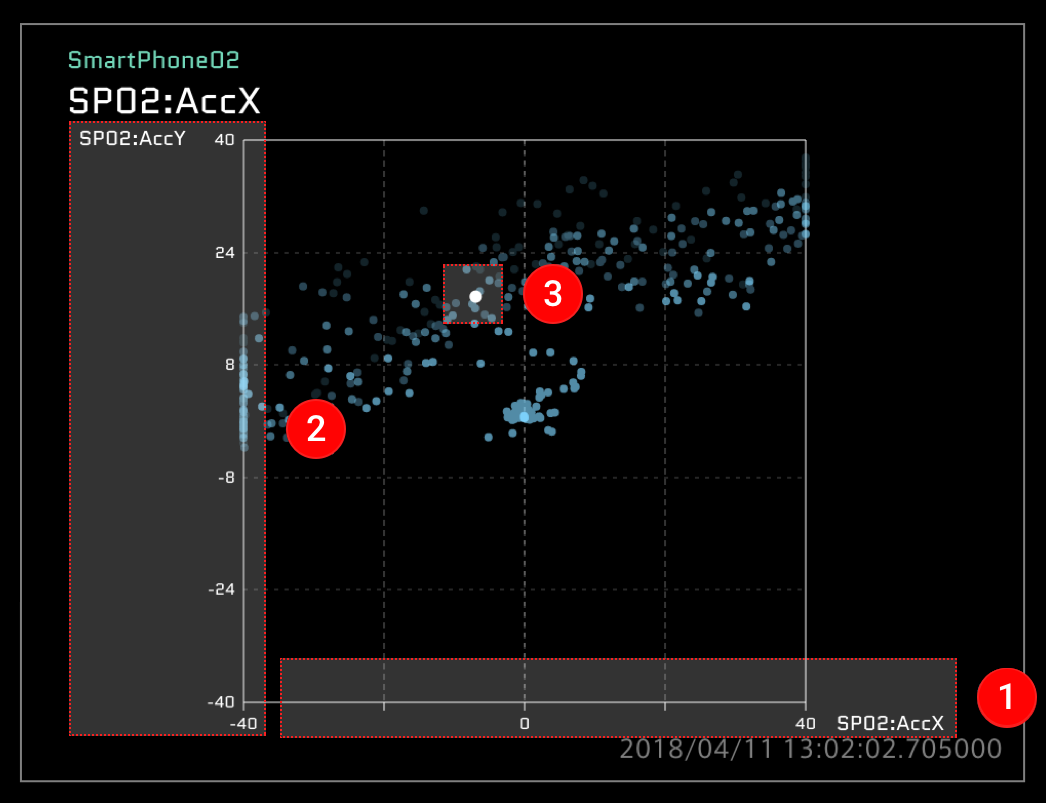
16.3.6.1. Description of the window#
Data01 is displayed as the X axis.
Data02 is displayed as the Y axis.
The instantaneous value is displayed.
16.3.6.2. Panel Settings#
Setting item |
Required / Optional |
Settings |
|---|---|---|
Panel Name |
Optional |
Enter the name to be displayed on the panel. |
Bind Data |
Required |
Select the device where the data is collected (edge) and the data you want to display. Two data items are always necessary. |
Rendering Speed |
Required |
The update frequency. The default is 10 fps. Increasing the value of Rendering Speed increases the processing load. If the load is too high, the panel may not be updated at the specified frequency. |
16.3.6.3. Panel Option#
Setting item |
Required / Optional |
Settings |
|---|---|---|
Data Range - X Axis |
Optional |
Set the maximum and minimum values that can be displayed on the X axis (Data01). |
Data Range - Y Axis |
Optional |
Set the maximum and minimum values that can be displayed on the Y axis (Data02). |
16.3.7. Oscilloscope#
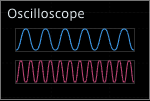
The Oscilloscope is a visual part for displaying repeated waveforms. When using the Line Graph visual part, the waveform of the entire measurement or selected range is displayed, whereas in Oscilloscope, the waveform of the specified short time range (Time Window) is cut out and displayed. As time passes, the display will be updated with the waveform of the new data.
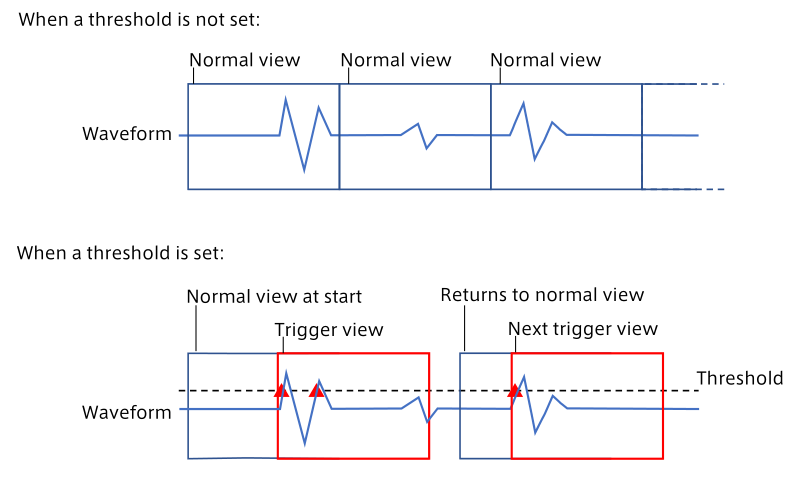
In Oscilloscope, "trigger view" is possible by setting thresholds on the Data Settings screen, which makes it possible to display the waveform in an easy-to-see format. A trigger occurs when the value is greater than the upper threshold or less than the lower threshold. When a trigger occurs, the waveform drawing area is updated from the left end. The waveform display in such case is called trigger view.
16.3.7.1. Description of the window#
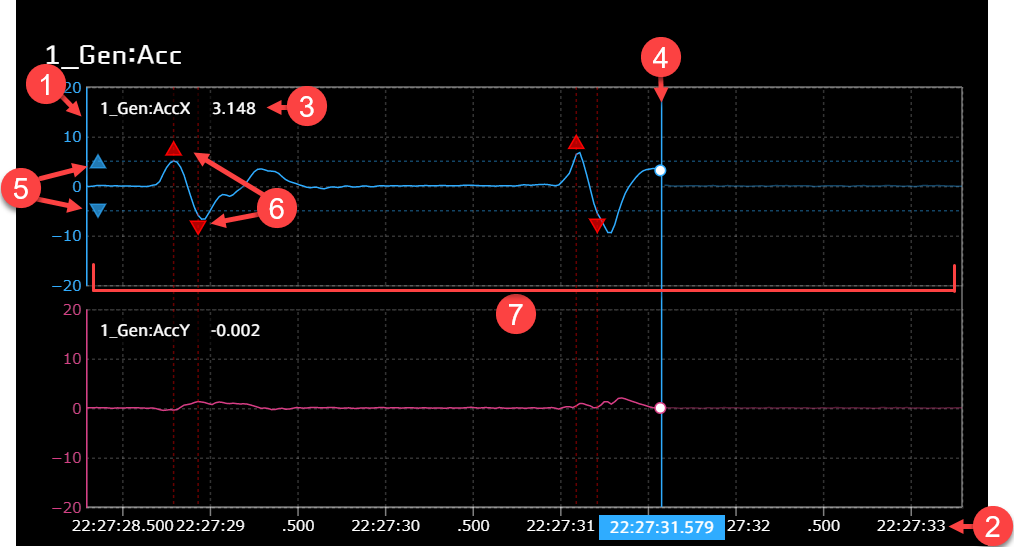
Up to 8 data can be bound.
Vertical axis. The range to be displayed can be set with the [Data Range] item in the Panel Option window.
Horizontal axis representing time. The displayed time range can be set in the [Time Window] of the Panel Option window.
Data name and current value.
Current position.
Thresholds used as triggers (Threshold set in  Data Settings).
A trigger marker ( ▲ ▼ ) indicating that the value exceeds the threshold, and a trigger has occurred. Hover your mouse over the trigger marker to see when the trigger occurred.
Waveform drawing area.
16.3.7.2. Panel Settings#
Setting item |
Required / Optional |
Settings |
|---|---|---|
Panel Name |
Optional |
Enter the name to be displayed on the panel. |
Bind Data |
Required |
Select the device where the data is collected (edge) and the data you want to display. |
Rendering Speed |
Required |
The update frequency. Default is 20 fps. Increasing the Rendering Speed increases the processing load. If the processing load is too high, the panel may not be updated at the specified frequency. |
16.3.7.3. Panel Option#
Setting item |
Required / Optional |
Settings |
|---|---|---|
Data Range |
Optional |
Set the maximum and minimum values on the vertical axis. |
Time Window (sec) |
Optional |
Set the length of the time range displayed on the horizontal axis. |
Trigger Position (%) |
Optional |
Set the position where the trigger is displayed in the waveform drawing area. For example, if the Trigger Position is 10%, the trigger will be displayed 10% from the left end of the waveform drawing area. 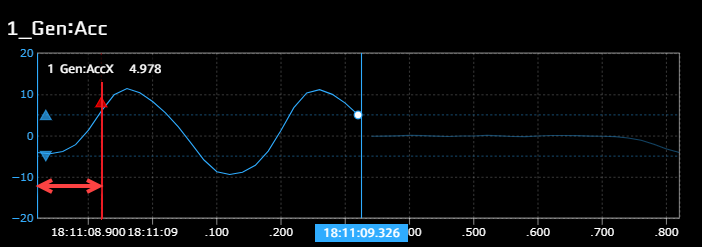
|
Trigger View Timeout (sec) |
Optional |
When a trigger occurs, the Oscilloscope switches to the trigger view, but after a certain period of time, it returns to the normal view. Trigger View Timeout sets the time until the waveform returns to the normal view after it reaches the right edge in the trigger view. For example, if Trigger View Timeout is set to 1 second, the current trigger view will be maintained for 1 second after the waveform reaches the right edge. After that, it returns to the normal view. |
Trigger Holdoff (sec) |
Optional |
Set the minimum time from one trigger to the next. No trigger will occur within this time. |
Time Offset (sec) |
Optional |
Shifts the display time range. For example, setting the Time Offset to -0.2 shifts the display time range 0.2 seconds to the left. This setting is valid only for the normal view. Use Trigger Position to shift the time range in the trigger view. 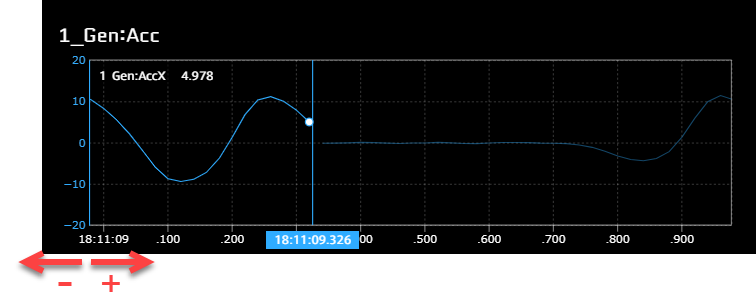
|
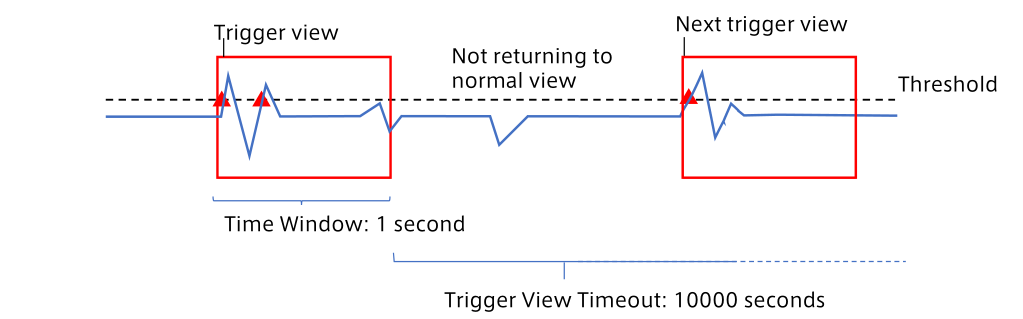
Note
Update the display only when the threshold is exceeded
The trigger view automatically returns to the normal view after the time set by Trigger View Timeout has elapsed. If you do not need to return to the normal view and want to check only the waveform when the trigger occurs, set a large value (for example, 10000 seconds) for Trigger View Timeout. This allows you to postpone the timing of returning to normal view so that the display does not update until a trigger occurs.
Example when Trigger View Timeout is set to a small value:
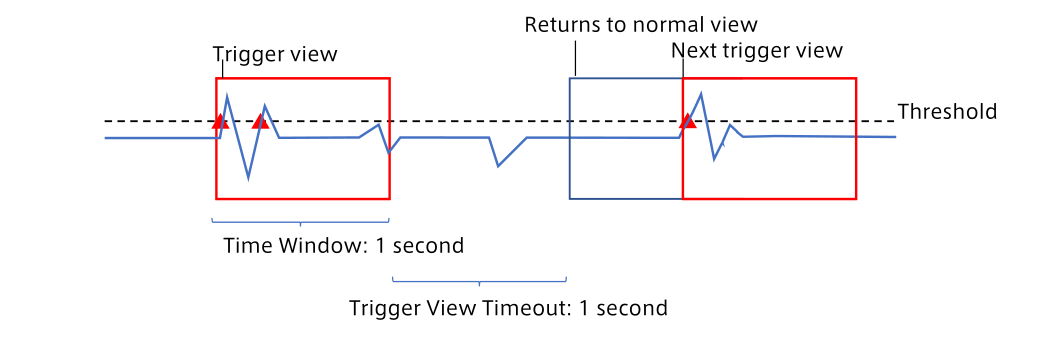
Example when Trigger View Timeout is set to a large value (Updates the display only when the threshold is exceeded):
16.4. Meter#
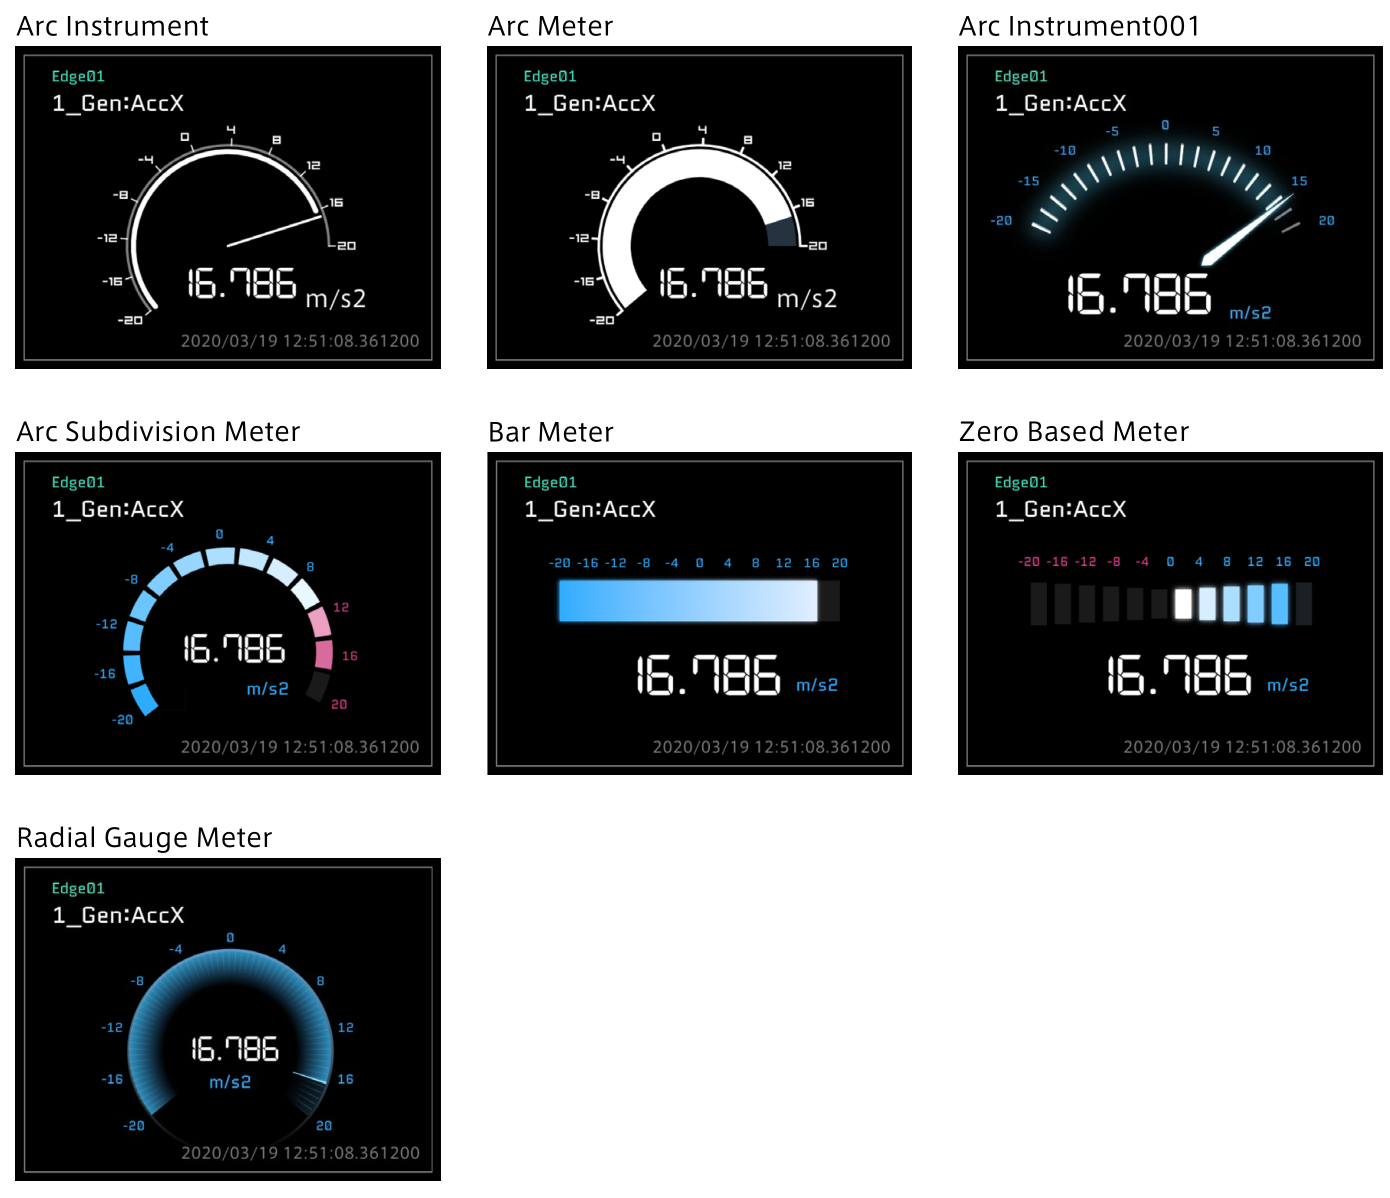
16.4.1. Various basic meters#
The following types of meters display one piece of bound data. Of these meters, Bar Meter and Zero Based Meter display the midpoint between minimum and maximum values (as set in Panel Option) at the center as the reference point. Zero Based Meter shows the difference from the reference point with a bar.
16.4.1.1. Panel Settings#
Setting item |
Required / Optional |
Settings |
|---|---|---|
Panel Name |
Optional |
Set the name to be displayed on the panel. |
Bind Data |
Required |
Select the device where the data is collected (edge) and the data you want to display. |
Rendering Speed |
Required |
The update frequency. Default is 20 fps. Increasing the Rendering Speed increases the processing load. If the processing load is too high, the panel may not be updated at the specified frequency. |
16.4.1.2. Panel Option#
Setting item |
Required / Optional |
Settings |
|---|---|---|
Data Range - Axis |
Optional |
Set the maximum and minimum values of the meter. |
Ticks |
Optional |
Set the number of ticks of the meter. |
16.4.2. Radar Chart#
Radar Chart displays multiple data items on a radar chart. Up to 10 data items can be bound to one radar chart.
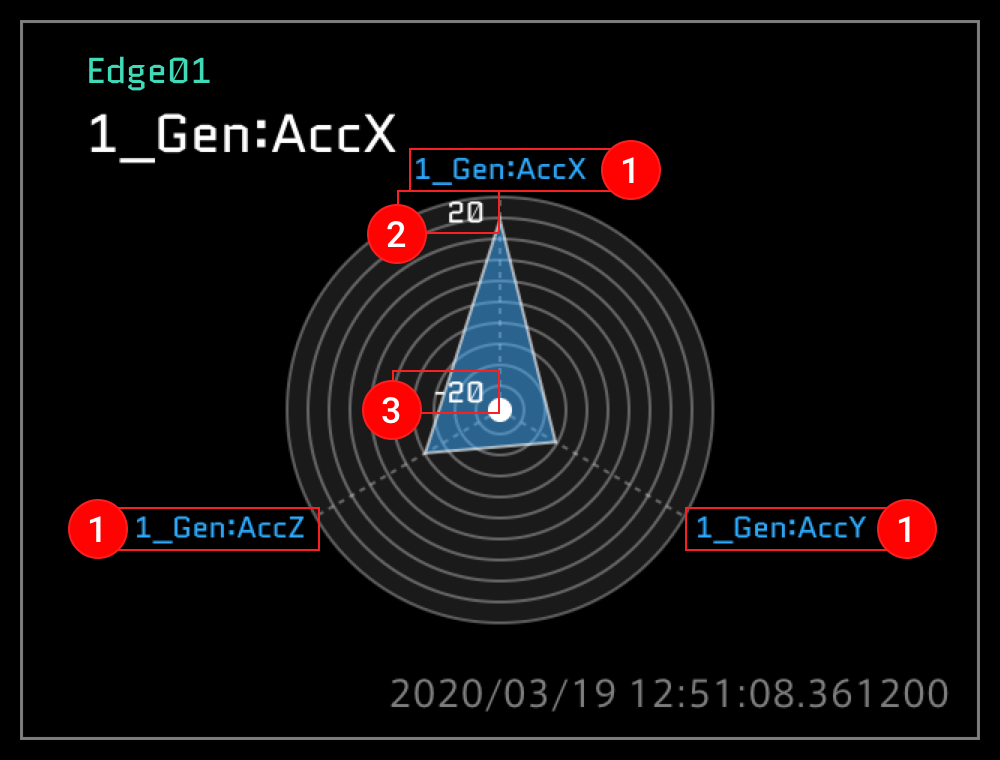
16.4.2.1. Description of the window#
The set data name is displayed.
The max Data Range of Data01 is displayed (this can be changed with Data Range of Panel Option).
The min Data Range of Data01 is displayed (this can be changed with Data Range of Panel Option).
Note
The maximum and minimum values of a radar chart can be set only for Data01.
16.4.2.2. Panel Settings#
Setting item |
Required / Optional |
Settings |
|---|---|---|
Panel Name |
Optional |
Set the name to be displayed on the panel. |
Bind Data |
Required |
Select the device where the data is collected (edge) and the data you want to display. |
Rendering Speed |
Required |
The update frequency. Default is 20 fps. Increasing the Rendering Speed increases the processing load. If the processing load is too high, the panel may not be updated at the specified frequency. |
16.4.2.3. Panel Option#
Setting item |
Required / Optional |
Settings |
|---|---|---|
Data Range - Axis |
Optional |
Set the maximum and minimum values of a radar chart. |
Ticks |
Optional |
Set the number of scales of a radar chart. |
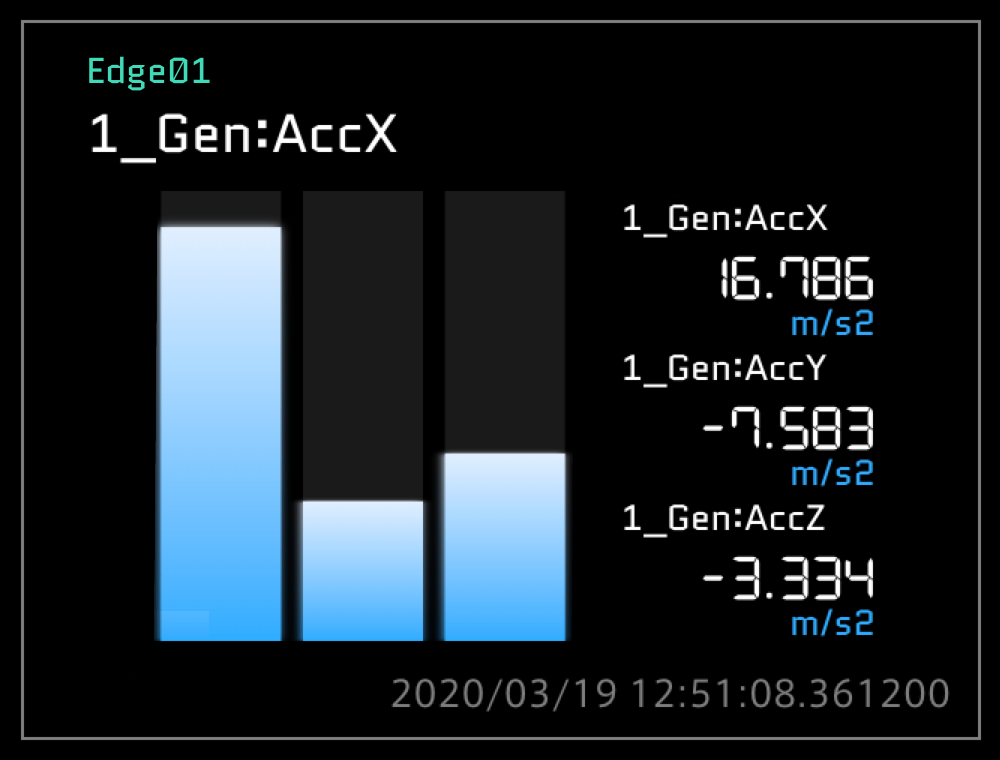
16.4.3. Vertical Bar Meter#
Vertical Bar Meter displays multiple data items in a bar graph. Up to 3 data items can be bound to one Vertical Bar Meter panel. You can set a different Data Range for each data.
16.4.3.1. Panel Settings#
Setting item |
Required / Optional |
Settings |
|---|---|---|
Panel Name |
Optional |
Set the name to be displayed on the panel. |
Bind Data |
Required |
Select the device where the data is collected (edge) and the data you want to display. |
Rendering Speed |
Required |
The update frequency. Default is 20 fps. Increasing the Rendering Speed increases the processing load. If the processing load is too high, the panel may not be updated at the specified frequency. |
16.4.3.2. Panel Option#
Setting item |
Required / Optional |
Settings |
|---|---|---|
Data Range - 1 |
Optional |
Set the maximum and minimum values of the display of Data01. |
Data Range - 2 |
Optional |
Set the maximum and minimum values of the display of Data02. |
Data Range - 3 |
Optional |
Set the maximum and minimum values of the display of Data03. |
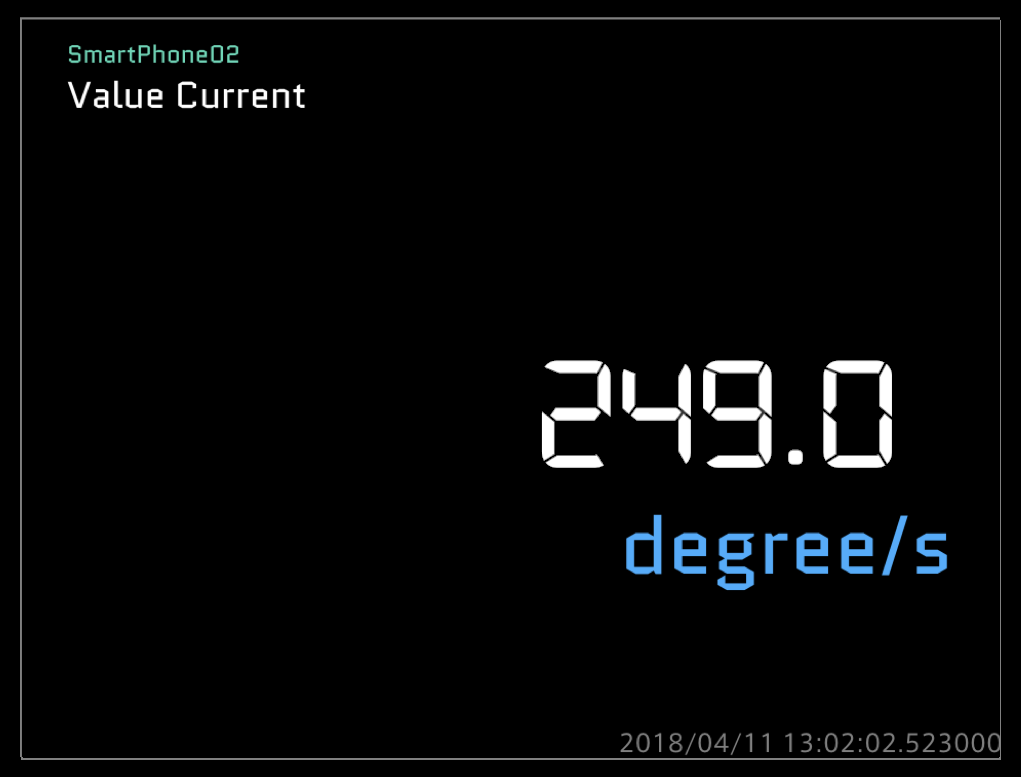
16.5. Label#
Label displays numeric values and character strings. Bind one data item to one Label panel.
Visual parts |
Function |
|---|---|
Value Current |
Displays the current value. |
Value Average |
Displays the average value in the loaded data. If you specify a range on the timeline, the average value in that range is displayed. |
Value Min |
Displays the minimum value in the loaded data. If you specify a range on the timeline, the minimum value in that range is displayed. |
Value Max |
Displays the maximum value in the loaded data. If you specify a range on the timeline, the maximum value in that range is displayed. |
Hex Label |
Displays the current value in hex format. |
Binary Label |
Displays the current value in binary format. |
Text Label |
Displays the current value in text format. |
16.5.1. Panel Settings#
Setting item |
Required / Optional |
Settings |
|---|---|---|
Panel Name |
Optional |
Set the name to be displayed on the panel. |
Bind Data |
Required |
Select the device where the data is collected (edge) and the data you want to display. |
Rendering Speed |
Required |
The update frequency. Default is 20 fps. Increasing the Rendering Speed increases the processing load. If the processing load is too high, the panel may not be updated at the specified frequency. |
16.5.2. Panel Option (only for Hex Label, Binary Label)#
Setting item |
Required / Optional |
Settings |
|---|---|---|
Data Range |
Optional |
Set the maximum and minimum values to be displayed. |
Byte Range |
Required |
Set a value between 0 and 4. |
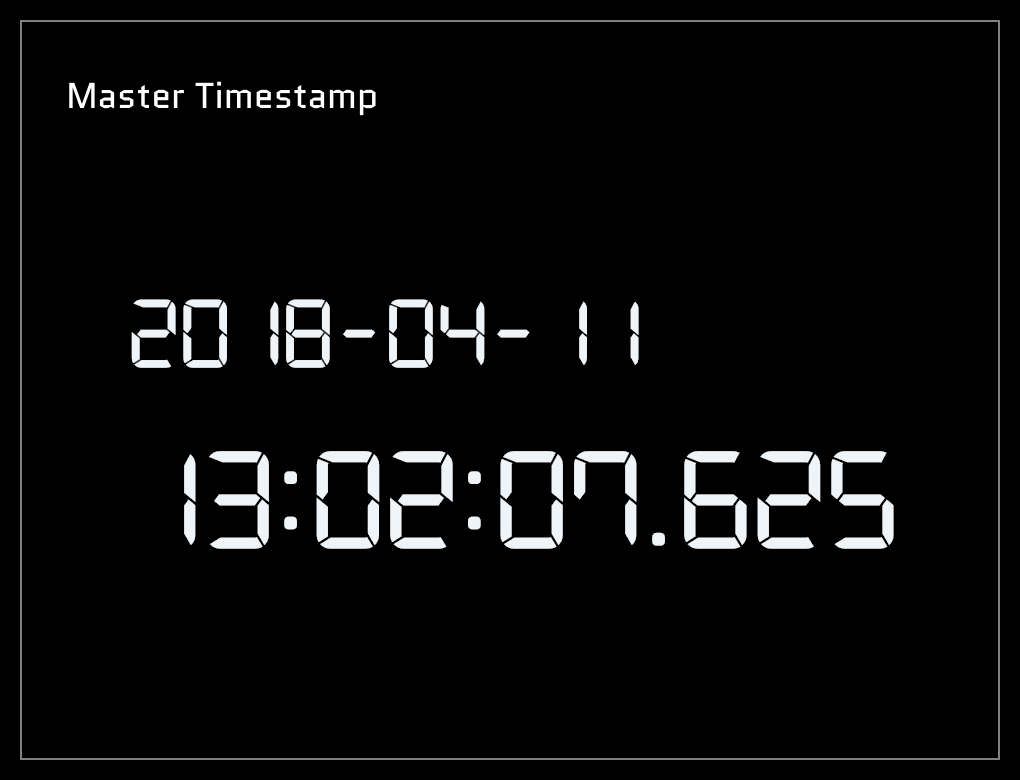
16.6. Master (Master Timestamp)#
16.6.1. Master Timestamp#
The master timestamp, which is the reference date and time for the timeline control, is displayed.
16.6.1.1. Panel Settings#
Setting item |
Required / Optional |
Settings |
|---|---|---|
Panel Name |
Optional |
Set the name to be displayed on the panel. |
Bind Data |
- |
You do not need to set Bind Data. |
Rendering Speed |
Required |
The update frequency. The default is 30 fps. Increasing the Rendering Speed increases the processing load. If the processing load is too high, the panel may not be updated at the specified frequency. |
16.6.1.2. Panel Option#
There is no item to set.
16.7. Position#
There are six types of visual parts contained in the Position category.
16.7.1. Shine Ball#
Shine Ball displays data on a two-dimensional (x axis and Y axis) plane. Bind two data items to one Shine Ball panel.
16.7.1.1. Description of the window#
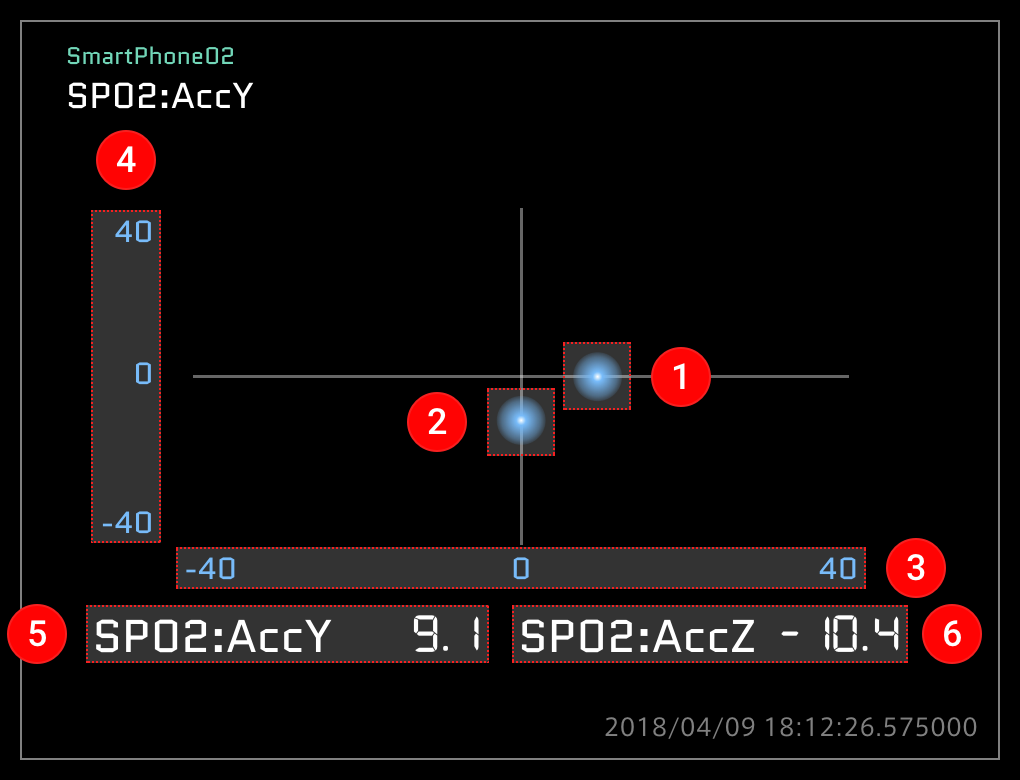
The instantaneous value of Data01 is displayed as a sphere.
The instantaneous value of Data02 is displayed as a sphere.
The Data Range set in Data01 is displayed (X axis).
The Data Range set in Data02 is displayed (Y axis).
The instantaneous value of Data01 is displayed.
The instantaneous value of Data02 is displayed.
16.7.1.2. Panel Settings#
Setting item |
Required / Optional |
Settings |
|---|---|---|
Panel Name |
Optional |
Set the name to be displayed on the panel. |
Bind Data |
Required |
Select the device where the data is collected (edge) and the data you want to display. |
Rendering Speed |
Required |
The update frequency. Default is 20 fps. Increasing the Rendering Speed increases the processing load. If the processing load is too high, the panel may not be updated at the specified frequency. |
16.7.1.3. Panel Option#
Setting item |
Required / Optional |
Settings |
|---|---|---|
Data Range - X Axis |
Optional |
Set the maximum and minimum values that can be displayed on the X axis (Data01). |
Data Range - Y Axis |
Optional |
Set the maximum and minimum values that can be displayed on the Y axis (Data02). |
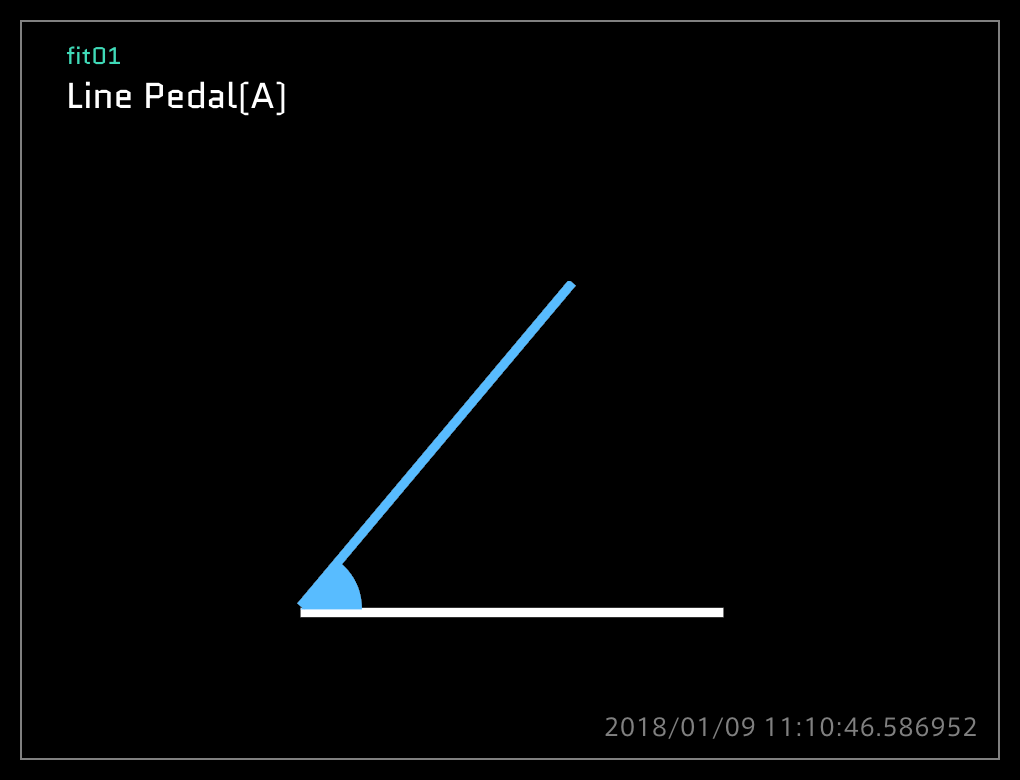
16.7.2. LINE Pedal (A), (B)#
LINE Pedal displays a graphic whose angle varies resembling a pedal. Bind one data item to one LINE Pedal panel.
16.7.2.1. Panel Settings#
Setting item |
Required / Optional |
Settings |
|---|---|---|
Panel Name |
Optional |
Set the name to be displayed on the panel. |
Bind Data |
Required |
Select the device where the data is collected (edge) and the data you want to display. |
Rendering Speed |
Required |
The update frequency. Default is 20 fps. Increasing the Rendering Speed increases the processing load. If the processing load is too high, the panel may not be updated at the specified frequency. |
16.7.2.2. Panel Option#
Setting item |
Required / Optional |
Settings |
|---|---|---|
Data Range |
Optional |
Set the maximum and minimum values to be displayed. |
16.7.3. Accel Brake Pedal#
Accel Brake Pedal displays graphics resembling the vehicle accelerator pedal and brake pedal. Bind two data items for accelerator and brake to one Accel Brake Pedal panel.
16.7.3.1. Description of the window#
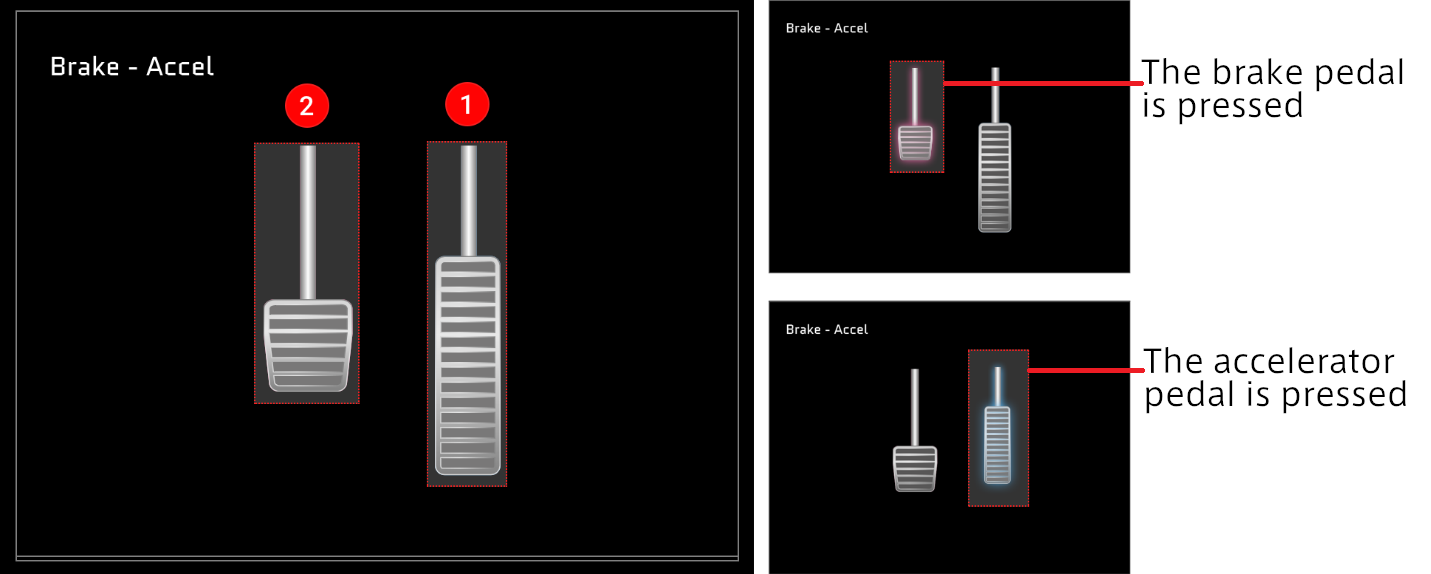
The data set in Data01 is displayed as a pedal image.
The data set in Data02 is displayed as a pedal image.
Note
Setting accelerator and brake
Set the accelerator data for Data01. Set the brake data for Data02.
If Data01 and Data02 are set reversely, the accelerator operation and the brake operation are reversed.
16.7.3.2. Panel Settings#
Setting item |
Required / Optional |
Settings |
|---|---|---|
Panel Name |
Optional |
Set the name to be displayed on the panel. |
Bind Data |
Required |
Select the device where the data is collected (edge) and the data you want to display. Set the accelerator data for Data01 and the brake data for Data02. |
Rendering Speed |
Required |
The update frequency. Default is 20 fps. Increasing the Rendering Speed increases the processing load. If the processing load is too high, the panel may not be updated at the specified frequency. |
16.7.3.3. Panel Option#
Setting item |
Required / Optional |
Settings |
|---|---|---|
Data Range - Brake |
Optional |
Set the maximum and minimum values. |
Data Range - Accel |
Optional |
Set the maximum and minimum values. |
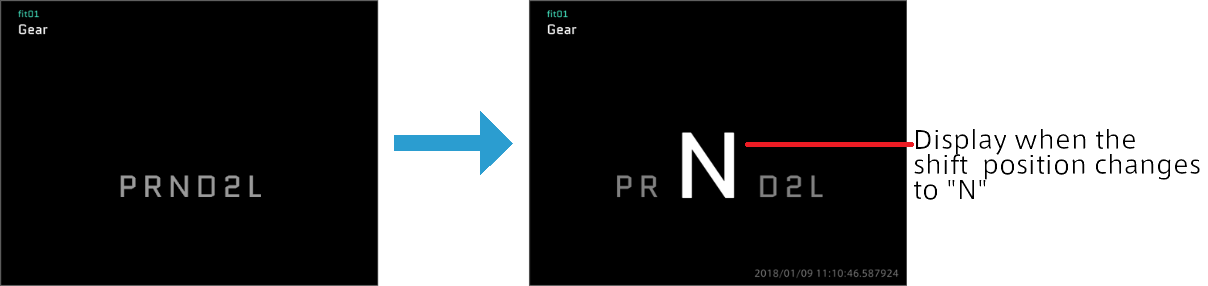
16.7.4. AT Gear#
AT Gear displays a graphic resembling the shift indicator of an automatic transmission. Bind one data item to the AT Gear panel.
16.7.4.1. Panel Settings#
Setting item |
Required / Optional |
Settings |
|---|---|---|
Panel Name |
Optional |
Set the name to be displayed on the panel. |
Bind Data |
Required |
Select the device where the data is collected (edge) and the data you want to display. |
Rendering Speed |
Required |
The update frequency. Default is 20 fps. Increasing the Rendering Speed increases the processing load. If the processing load is too high, the panel may not be updated at the specified frequency. |
16.7.4.2. Panel Option#
There is no item to set.
16.8. Rotation#
There are four types of visual parts contained in the Rotation category.
16.8.1. Compass and Rotation#
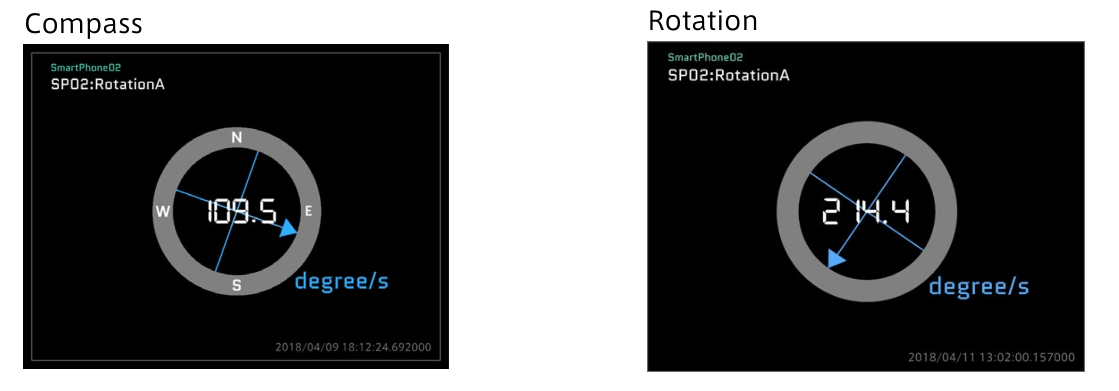
Compass and Rotation display the direction. Bind one data item to the panel to display Compass or Rotation. The direction (N, E, W, S) is shown in Compass, but not in Rotation.
16.8.1.1. Panel Settings#
Setting item |
Required / Optional |
Settings |
|---|---|---|
Panel Name |
Optional |
Set the name to be displayed on the panel. |
Bind Data |
Required |
Select the device where the data is collected (edge) and the data you want to display. |
Rendering Speed |
Required |
The update frequency. Default is 20 fps. Increasing the Rendering Speed increases the processing load. If the processing load is too high, the panel may not be updated at the specified frequency. |
16.8.1.2. Panel Option#
There is no item to set.
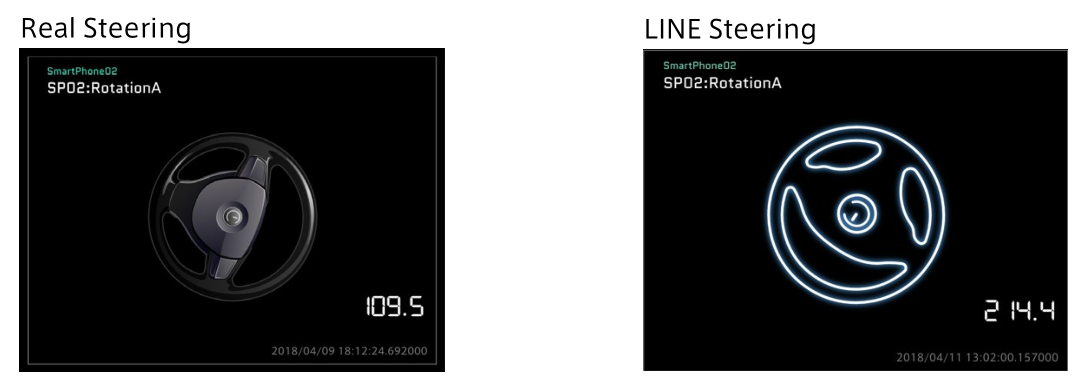
16.8.2. Real Steering and LINE Steering#
Real Steering and LINE Steering display graphics resembling the steering wheel of a vehicle. Bind one data item to the panel that displays Real Steering or LINE Steering.
16.8.2.1. Panel Settings#
Setting item |
Required / Optional |
Settings |
|---|---|---|
Panel Name |
Optional |
Set the name to be displayed on the panel. |
Bind Data |
Required |
Select the device where the data is collected (edge) and the data you want to display. |
Rendering Speed |
Required |
The update frequency. Default is 20 fps. Increasing the Rendering Speed increases the processing load. If the processing load is too high, the panel may not be updated at the specified frequency. |
16.8.2.2. Panel Option#
There is no item to set.
16.9. Stream (list view)#
There is only one type of visual part contained in the Stream category.
16.9.1. Text Stream#
Text Stream displays the timestamps and values of data in a list format. Bind one data item to the Text Stream panel. The list of data items is displayed in descending order of timestamps.
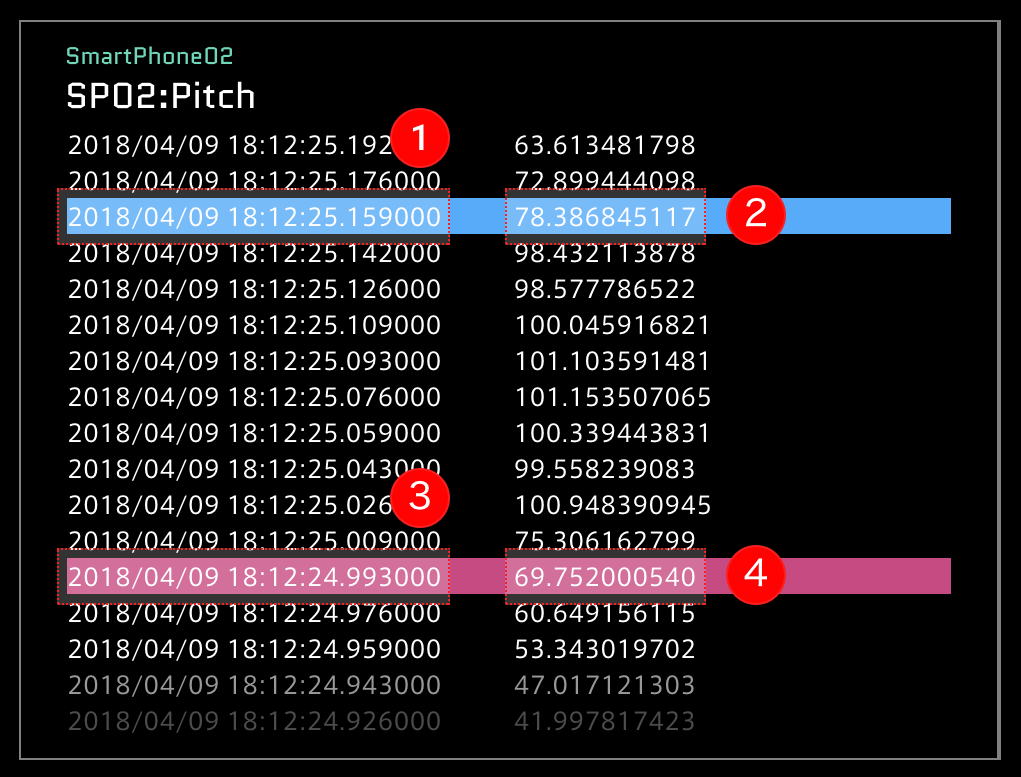
16.9.2. Description of the window#
The timestamp of Current Position is displayed (instantaneous value).
The value of Current Position is displayed (instantaneous value)
The timestamp of Compared Position (comparison position) is displayed.
The value of Compared Position (comparison position) is displayed.
Note
Display of Compared Position
The Compared Position is displayed in red even if Show Compared Position in Timeline Settings is set to OFF.
16.9.2.1. Panel Settings#
Setting item |
Required / Optional |
Settings |
|---|---|---|
Panel Name |
Optional |
Set the name to be displayed on the panel. |
Bind Data |
Required |
Select the device where the data is collected (edge) and the data you want to display. |
Rendering Speed |
Required |
The update frequency. Default is 20 fps. Increasing the Rendering Speed increases the processing load. If the processing load is too high, the panel may not be updated at the specified frequency. |
16.9.2.2. Panel Option#
There is no item to set.
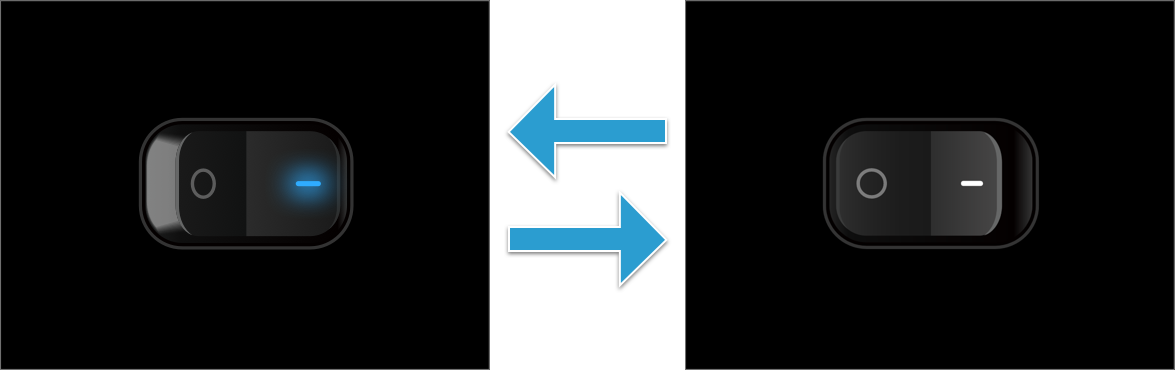
16.10. Switch#
There are four types of visual parts contained in the Switch category. The value of one piece of bound data is displayed as ON (0) or OFF (1).
- Label Switch
The setting is displayed as "ON" or "OFF".

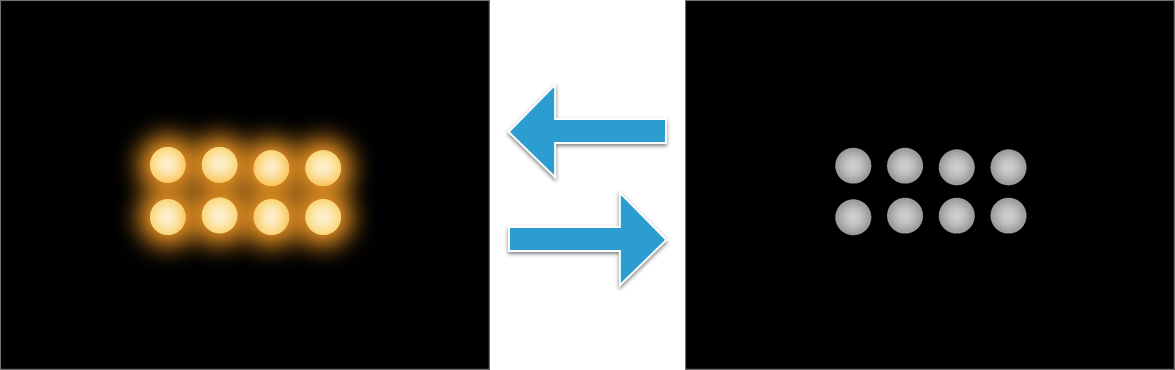
- Signal Switch
The ON/OFF setting is displayed with a glowing lamp image.
- Rocker Switch
The ON/OFF setting is displayed with a rocker switch (seesaw switch) image.
- Slide Switch
The ON/OFF setting is displayed with a slide switch image.

16.10.1. Panel Settings#
Setting item |
Required / Optional |
Settings |
|---|---|---|
Panel Name |
Optional |
Set the name to be displayed on the panel. |
Bind Data |
Required |
Select the device where the data is collected (edge) and the data you want to display. |
Rendering Speed |
Required |
The update frequency. Default is 20 fps. Increasing the Rendering Speed increases the processing load. If the processing load is too high, the panel may not be updated at the specified frequency. |
16.10.2. Panel Option#
There is no item to set.
16.11. 3D#
16.11.1. SmartPhone#
The attitude and acceleration are displayed with a smartphone graphic.
16.11.1.1. Description of the window#
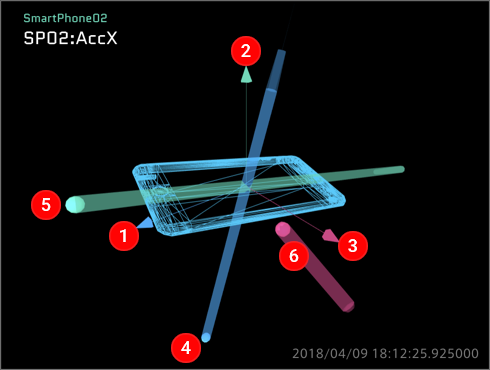
Displays the X axis.
Displays the Y axis.
Displays the Z axis.
Displays the X acceleration.
Displays the Y acceleration.
Displays the Z acceleration.
16.11.1.2. Panel Settings#
Setting item |
Required / Optional |
Settings |
|---|---|---|
Panel Name |
Optional |
Set the name to be displayed on the panel. |
Bind Data |
Required |
Select the device where the data is collected (edge) and the data you want to display. |
Rendering Speed |
Required |
The update frequency. Default is 20 fps. Increasing the Rendering Speed increases the processing load. If the processing load is too high, the panel may not be updated at the specified frequency. |
16.11.1.3. Panel Option#
Setting item |
Required / Optional |
Settings |
|---|---|---|
model Rotation X |
Required |
Set the offset of the model X-axis rotation. |
model Rotation Y |
Required |
Set the offset of the model Y-axis rotation. |
model Rotation Z |
Required |
Set the offset of the model Z-axis rotation. |
local Rotation X |
Required |
Set the offset of the local X-axis rotation. |
local Rotation Y |
Required |
Set the offset of the local Y-axis rotation. |
local Rotation Z |
Required |
Set the offset of the local Z-axis rotation. |
orientation Angle |
Required |
Select [euler] or [quaternion] for the posture angle. |
coordinate System |
Required |
Select [left handed] or [right handed] for the coordinate system. |