9. Operate on the timeline#
You can bind the main measurement data to the timeline. Measurement data is displayed as a line graph.
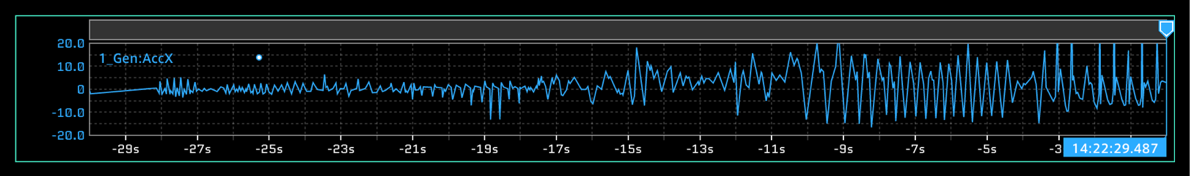
In real time playback, the specified time frame is displayed. In past data display, the entire time frame of the data is displayed.
9.1. Binding data to a timeline#
Select
 (Timeline Settings) from the function menu.
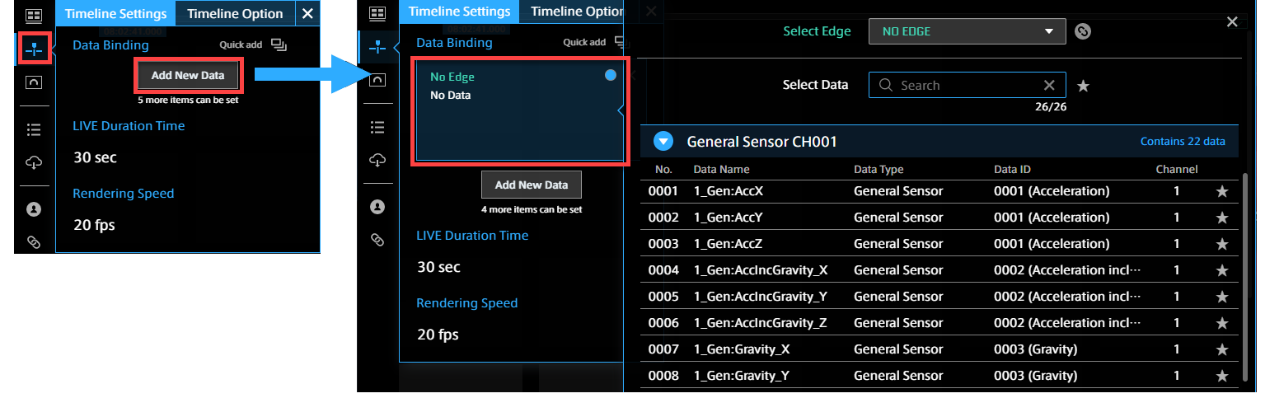
From the Data Bind item, select [Add New Data], and then set the measurement data to be bound.
* It is also possible to bind multiple measurement data items to a timeline (in the same way as Line Graph).
* The method for binding data is the same as that for a panel. For details, see Data binding.
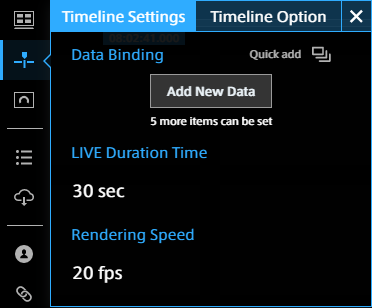
In [Live Duration Time], specify the range of data to be displayed in real time on the timeline.
9.1.1. Timeline Settings#
Setting item |
Required/Optional |
Settings |
|---|---|---|
Live Duration Time |
Required |
For live measurement, the time range of data to be displayed on the timeline. For example, if "30sec" is set, the data for 30 seconds from the current time is displayed. The default value is 30 seconds. |
Rendering Speed |
Required |
You can change the rendering interval of the timeline. Reducing the rendering speed can reduce the burden on the PC. |
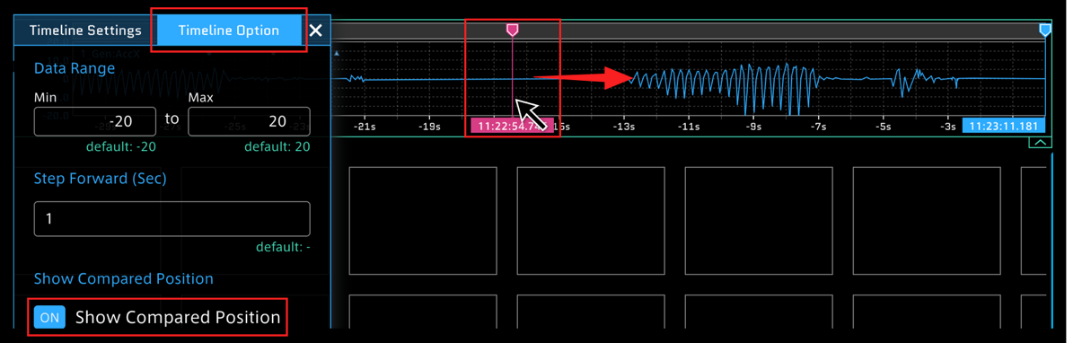
9.1.2. Timeline Option#
Setting item |
Required/Optional |
Settings |
|---|---|---|
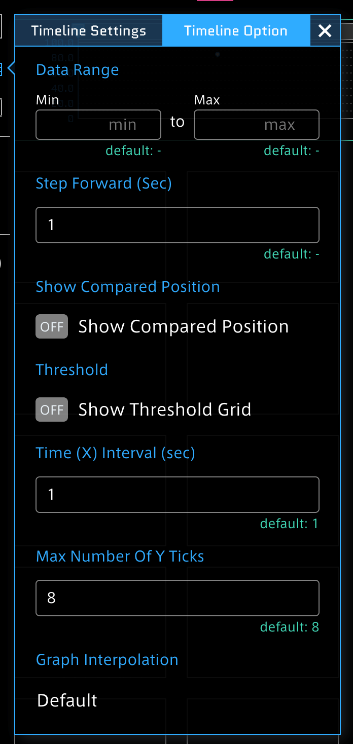
Data Range |
Optional |
Set the maximum and minimum values of the vertical axis. (Up to five sets of values can be set.) |
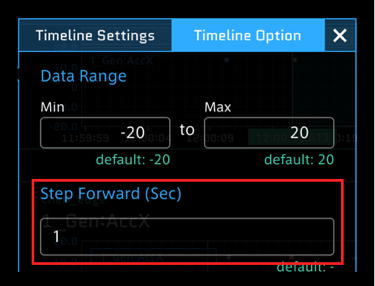
Step Forward (Sec) |
Optional |
You can set the frame advance width for Current Position. |
Show ComparedPosition |
Optional |
ON: Compared Position (comparison position) is displayed. OFF: Compared Position is not displayed. |
Threshold |
Optional |
ON: The threshold line set for data is displayed. OFF: The threshold line is not displayed. |
Time(X) Interval (sec) |
Optional |
Set the interval width for the horizontal axis. |
Max Number of Y Ticks |
Optional |
Set the interval width for the vertical axis. |
Graph Interpolation |
Optional |
Set the form of a graph. Default: Curved line graph Step: Stepped graph |
9.2. Cursor operation#
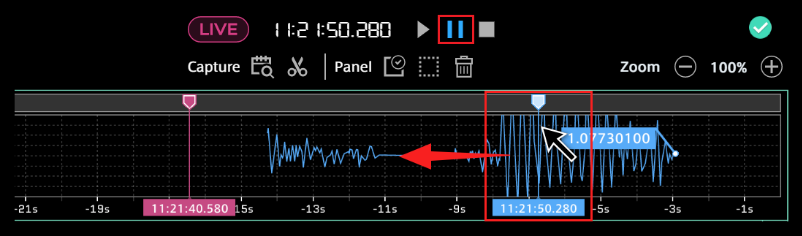
The timeline can display adjustable cursors to indicate two separate points in time: Current Position and Compared Position.
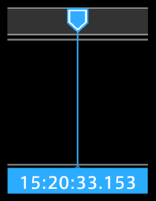
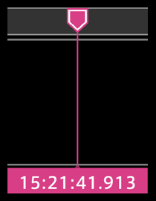
9.2.1. Current Position#
For real-time display, this will indicate the current point in time. For past data playback, this will indicate the stream replay point.
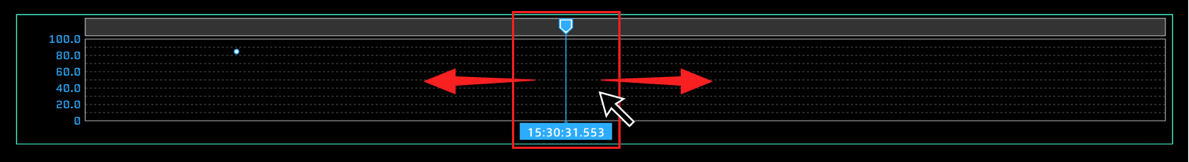
9.2.1.1. Method 1: Dragging Current Position#
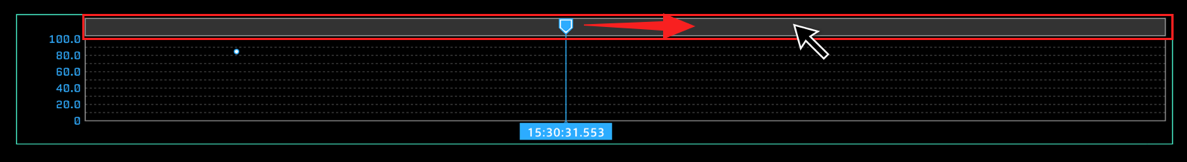
9.2.1.2. Method 2: Clicking a point on the timeline header#
Click a point on the timeline header to move the cursor to that position.
9.2.1.3. Method 3: Timeline control#
You can step backward or forward by selecting ![]() (Backwards) and
(Backwards) and ![]() (Forwards) on the timeline control.
(Forwards) on the timeline control.
The width of cursor movement is determined by the value set in [Timeline Options] > [Step Forward].
9.2.1.4. Method 4: Operation of the ← and → keys on the keyboard#
Press the [←] key to rewind, and press the [→] key to advance. The timeline will continue advancing or rewinding as long as the key is held down.
Note
Moving Current Position
Moving Current Position pauses playback.
After the operation is completed, for past data playback, the state prior to the drag operation (pause state/playback state) is applied. For real-time playback, playback remains paused.
9.2.2. Compared Position#
Compared Position is used as a position comparative to the Current Position. The differences in values between the Compared and Current Positions can be displayed.
To display Compared Position, select [Timeline Settings] from the function menu. Then, in the [Timeline Option] tab, set [Show Compared Position] to ON.
For both Compared Position and Current Position, the cursor can be moved via drag and drop operation.
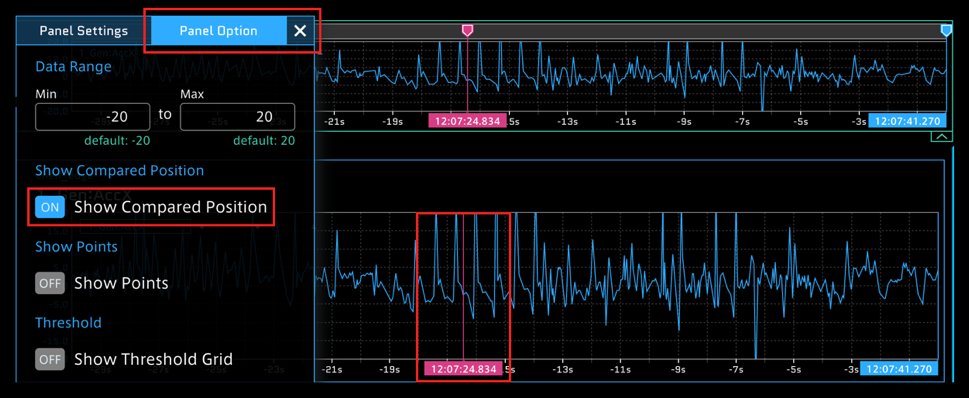
Note
To display Compared Position on Line Graph
Select the Panel Name on Line Graph, and then select [Panel Option].
Set [Show Compared Position] to ON.
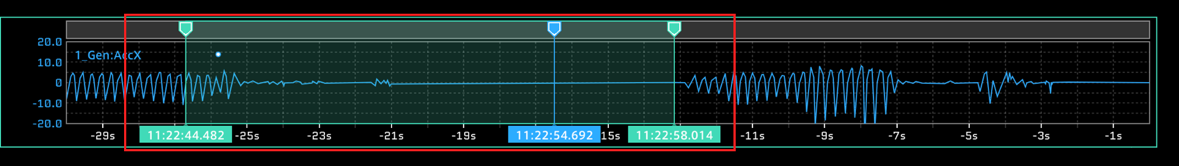
9.2.3. Specifying the timeline range#
When you drag the mouse to select an arbitrary time range on the timeline, a green cursor is displayed. You can use this green cursor to specify the display time range of the measurement data on the panel. Depending on the visual parts, the measurement data within the specified time range can be displayed.
* If the time range is not specified, the measurement data is displayed with the entire timeline.
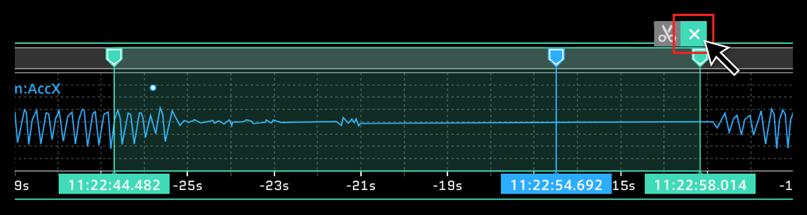
You can cancel the range specification by using the ![]() button in the menu displayed in the upper right when hovering the mouse over the green cursor.
button in the menu displayed in the upper right when hovering the mouse over the green cursor.
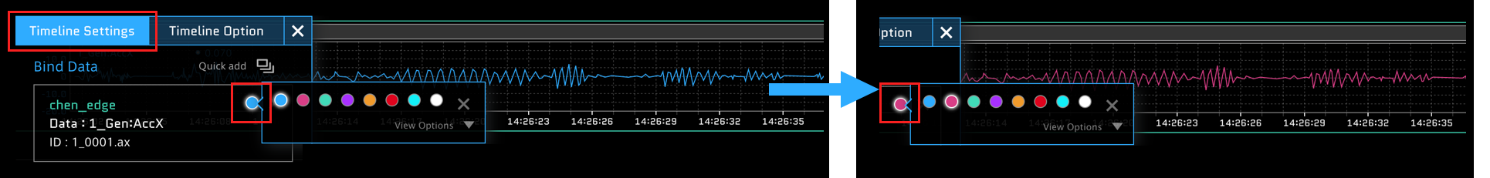
9.2.4. Setting timeline details#
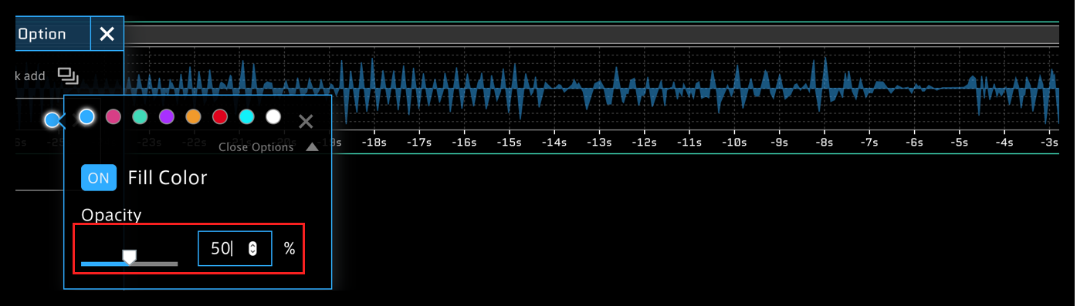
In [Timeline Settings], you can change the color or transparency of the timeline. Select the colored circle in [Bind Data] to open the advanced color settings.
9.2.4.1. Changing graph color#
9.2.4.2. Filling graph#
Click [Fill Color] to set it to [ON] to fill the displayed graph with the color.
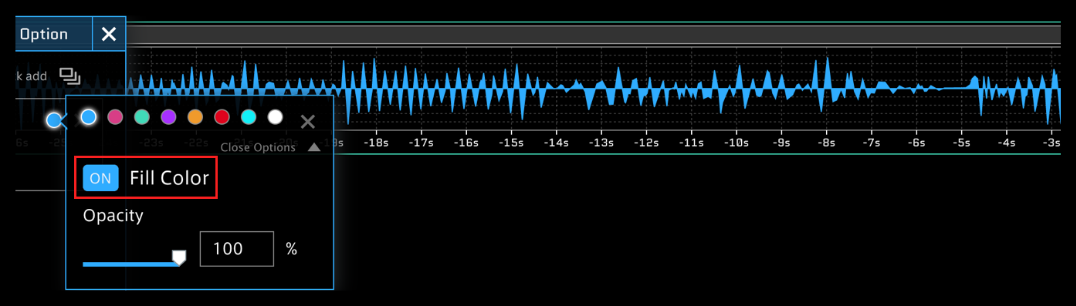
9.2.4.3. Changing the transparency of the graph#
You can change the transparency by dragging the [Opacity] slider or by directly entering a number.
* The above settings are also available from the Panel Settings window for Line Graph in visual parts.
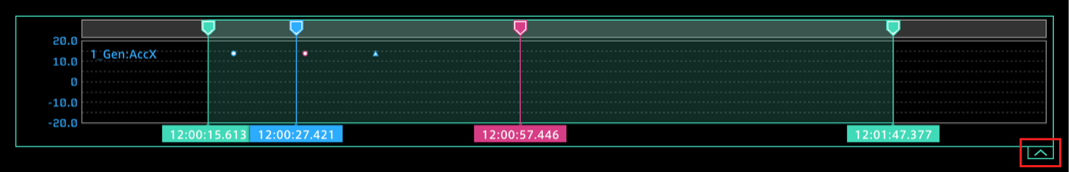
9.3. Switching the display size#
You can switch the display size between normal display and reduced display by using the button at the bottom right of the timeline.
Normal display
Reduced display
